synecologically One of the first strategies I ever developed in our currency trading community involved volatility breakout trading in the EUR/USD. This strategy – which I called Teyacanani – first saw the markets in 2009 and has been consistently profitable from then to present. Although the strategy did not survive for too long in its simplest initial form – as we improved it with time – the strategy has remained completely unmodified since 2013. This system remains exceptionally consistent and continues to be one of our most trusted strategies through the years. On this post I want to talk a little bit more about the past few years of trading for this strategy, how it has performed and how it might perform going forward.
–
–
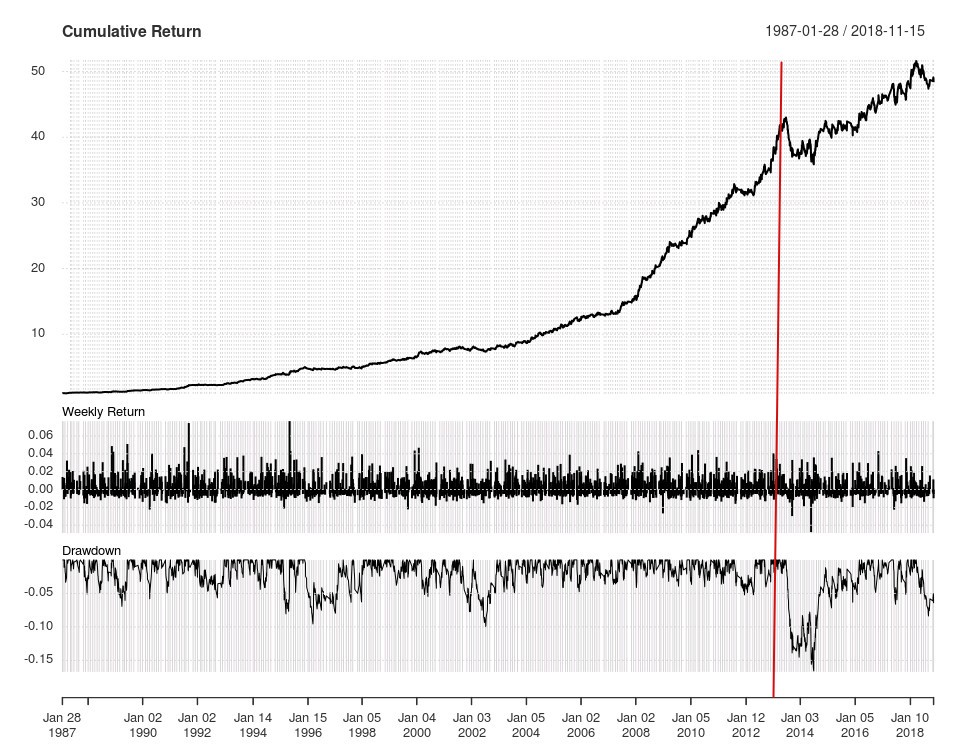
The equity curve above shows you the results of this volatility breakout strategy, taking a risk of 0.5% per trade. The last time we optimized this strategy – red line – was right before the system went into a new historical maximum drawdown, completely unprecedented in over 28 years of historical trading results. At that point – close to January 2014 – we had lost faith in the strategy and believed it would not be working again as it had gone significantly above the maximum level of historical loss we had ever seen, as a matter of fact the maximum drawdown after 2014 was almost 50% higher than the maximum drawdown up until that point. Since the risk seemed much smaller before this drawdown we were actually trading this strategy at a higher risk, so we saw loses in the neighborhood of 30-40% through this time (reason why many stopped trading the strategy at this point in time). At this same time many people in the FX space had realized volatility breakouts were a good play – many of them thanks to our community – and many were trading even riskier or more highly leveraged versions of this strategy. Of course, this losing period caused volatility breakout to become relatively unpopular again.
However, after this drawdown phase ended, the strategy recovered swiftly and started to reach new equity highs relatively consistently up until this year, where it went into another significant drawdown period (currently 6.45%). Remarkably the compounded returns of the strategy remained relatively unaffected after the loses in 2013 – around 8% in the above graph – although the strategy did become significantly more volatile after this time, something that can be relatively easily attributed to the fact that the strategy’s alpha has decayed relative to its historical in-sample results obtained in hindsight (pre-2013). Of course some people discovered the strategy after 2014 and many started trading versions of this strategy that contain mechanisms to avoid the losing period in 2013, of course, at the cost of additional curve-fitting bias in the mix. Not surprisingly some of these traders are currently facing drawdowns in the order of 20-30%, as you would expect if you traded this strategy at a higher risk (since their fitting to avoid the 2013 drawdown really did nothing to prevent losses under current market conditions).
–
–
At the time we also made significant efforts to develop these volatility breakout strategies outside of the EURUSD but it turned out that these strategies were never as consistent in other pairs and seemed to require either much more complicated parameters or fell appart in forward testing after deployment. Some currencies even showed promise for the opposite of volatility breakouts – which we can call volatility mean-reversals – but these too did not seem to be very stable and ended up giving back a considerable portion of their alpha after deployment. Many people actually tried more fancy techniques – including walk forward analysis – to deal with these problems but as far as I can tell few were able to consistently tackle the issue of volatility breakouts across other pairs. I know that my friend and colleague Fernando Monera developed a strategy called RobinVol using this sort of principle – volatility breakouts and mean-reversals for different pairs – and achieved a good measure of success on live accounts up until at least 2017 (as you can see here). Sadly this flagship live account – which I believe was traded by a third party – is no longer being updated so we are unaware of how his setup has behaved under more recent market conditions. Fernando definitely studied volatility breakouts more deeply than we ever did at Asirikuy.
Other people have also had great success with volatility breakouts during the past couple of years, for example these traders at Darwinex have a strategy that is heavily correlated with Teyacanani and probably heavily uses similar forms of volatility breakout trading. They clearly use more currency pairs and probably some complimentary strategies, but the equity curve shows a steep drawdown during the past 4 months, in agreement with what you would expect from heavy exposure to volatility breakout trading on the Forex majors this year. They are currently right next to a historical maximum drawdown for their strategy portfolio and it wouldn’t be surprising if the real risk of their trading setup eventually exceeds the 50% level, given the magnitude of the returns they have been able to offer traders during the past several years. As I have commented in the past it is exceedingly rare for managers to beat 1:2 maximum drawdown to average compounding return ratios in the long term, so eventually either the drawdowns or the returns mean-revert to more realistic levels. This can be confirmed by analyzing long term currency traders, such as those included in the Barclay’s currency trader index (read this 2010 post for more info).
–

–
Volatility breakout continues to be a time-tested and reliable fx trading online technique which has been able to deliver returns consistently during the past 10 years. Although volatility breakout is by no means a holy grail – as evidenced by the steep drawdowns faced when people try to over-leverage or curve-fit it – it does remain a reliable investment strategy for those who wish to experience diversification from traditional bond and stock investments in the currency markets. Realistically volatility breakout strategies can offer a slightly higher than 1:1 average compounded return to maximum drawdown ratio and can therefore potentially deliver consistent returns for those who have realistic goals with adequate risk management in mind. In my view a 15% CAGR with a 15% maximum drawdown is extremely valuable given that these returns are likely to hold weak correlations to traditional investment vehicles. However the drawdowns will always inevitably arrive as over-crowding of the trade will tend to generate periods where the inefficiency temporarily decays, however the inefficiency is expected to recover after the market “shakes off” highly levered players through these periods.


