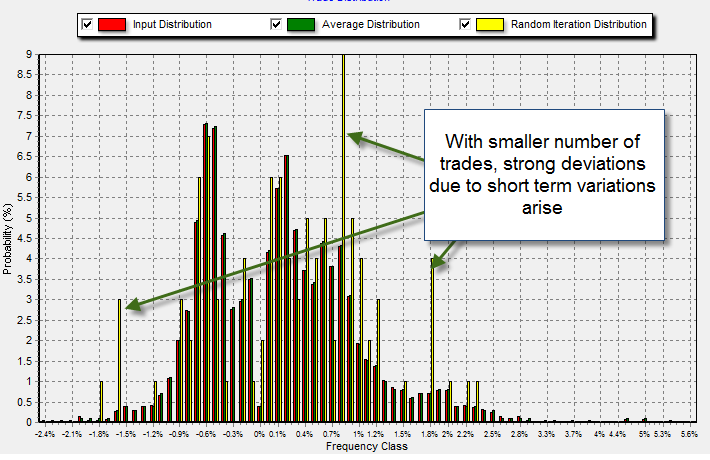
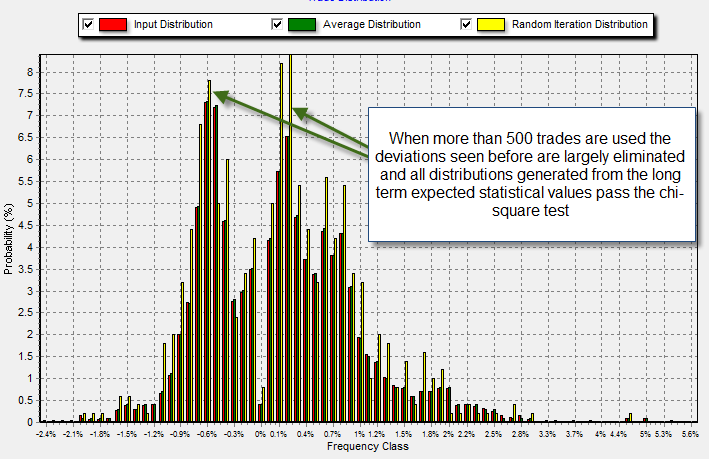
Last week I wrote a post about the evaluation of trading systems using the new distribution-based capabilities of our Asirikuy Monte Carlo simulator and how this new feature now allows us to perform much more accurate simulations of our trading strategies. The latest version of the simulator also included an implementation of the chi-square goodness-of-fit test which allows us to see if the random distributions generated through the input distribution can be evaluated through this criterion. On today’s post I will be writing some of my finding regarding the evaluation of distributions and particularly how many trades we need in order to accurately evaluate a trading system’s distribution against the long term distribution we derive from the 11 year backtests.
First of all it becomes important to understand what a trade distribution is and why it is important. The distribution of trades is simply a way of organizing data in which we divide the trades taken by the strategy into different categories and then assign a probability to each category based on the amount of trades which have fallen within it. For example if a strategy made 20 trades of which 10 made a 5% profit and 10 made a 5% loss we could divide the system’s results into two categories, trades between 4.9-5.1% and trades between -4.9 and -5.1%, both categories would have a 50% probability of getting a trade.
–
The distribution of returns is important since it allows us to see how much a given strategy has changed when time goes on. For example if the strategy explained before had another 20 trades and from these trades 15 had a -5% loss we would in fact see that the characteristics of the system have mutated significantly since the probability of classes has shifted to a large degree. Such criterion based on the distribution of returns is useful to help us stop using a strategy if its returns start to look very different than the back-tests, something that could potentially help us stop trading a strategy before we actually reach the draw down levels determined to be worst case scenarios by the Monte Carlo simulations.
However an interesting question arises once you consider the distribution of returns. How many trades would you need to take to generate a distribution which – if it belong to the strategy – has a high probability to pass the chi-square goodness-o-fit test ? Put into simpler words, how many trades are needed to tell if the system has been trading like its supposed to ? The answer to this question isn’t trivial as it is likely to depend on the overall shape of the distribution of returns, the number of classes and the probability values between the classes themselves.
–
In order to evaluate this I decided to carry out a few experiments using different system types to see which ones could potentially be evaluated using this chi-square test and how many trades were needed to perform the evaluation in a way in which it was meaningful. After running all the tests it became evident that strategies with low class numbers with many classes having probabilities close to 0% failed the chi-square test even when large trade numbers were present due to the large error contributions of important classes with very low probabilities in which small deviations from the 11 year backtesting distribution get horribly magnified. It seems that a system needs to have at least 10 or more classes in order for the contribution of low frequency classes (or the errors amongst them) to be cancelled efficiently.
Regarding the trade number, the exact number depends on the number of classes since the higher the number the higher the number of trades that is needed to “fill” each category appropriately. However after testing many portfolios and individual systems it became apparent that 500 is sort of a “universal minimum” from which all systems start to show distributions which always pass the chi-square goodness-of-fit test. This means that for a system that has more than 10 classes and 500 trades we can say that a failure to pass a chi-square test constitutes a big reason to stop trading the strategy since there is a high probability that results now do NOT fall in line with what is expected from the strategy’s long term results.
In particular this might now be very useful for the evaluation of individual systems – as most will take many years if not decades to reach that trade number – but it may prove as a very useful criteria for the evaluation of portfolios given that portfolios usually have many trades distributed amongst many classes from which a trade number of 500 could potentially be gathered in less than a couple of years (of course depending on the portfolio).
My findings here show then that distribution tests might be of limited value to evaluate individual systems (due to the number of classes and the number of trades required to perform a meaningful test) but portfolios may in fact be accurately evaluated using this sort of methodology to gauge whether their medium term results are in fact falling in line with the expected distributions of return. A combination of the distribution and worst case analysis of a portfolio coupled with the individual draw down analysis of each strategy is bound to be one of our most powerful tools for on-the-fly system evaluation.
If you would like to learn more about Monte Carlo simulations, worst cases and system evaluation please consider joining Asirikuy.com, a website filled with educational videos, trading systems, development and a sound, honest and transparent approach towards automated trading in general . I hope you enjoyed this article ! :o)


