Last week an Asirikuy member emailed me about the use of the support and resistance oscillators developed by Mel Widner in the mid 1990s. These two indicators were published on an issue of the stock & commodities magazine in 1996 and detail a simple way in which support and resistance values can be mathematically determined through the use of a few simple mathematical calculations. Since there is not much information about these indicators online I wanted to dedicate this post to them so that anyone interested in further studying trading techniques derived from these simple calculations can do so within MT4. Within the next few paragraphs I will discuss the math behind the WSO and WRO indicators (Widner’s Support/Resistance Oscillators) and how they may be used in the development of automated systems.
Through the years I have always been interested in the design of trading systems using support and resistance levels because my experience in both manual and mechanical trading has revealed that the closer one’s trading follows this basic market principle, the more profitable and robust trading strategies become. However the fact is that determining support and resistance in a mathematical way is no easy task and therefore it becomes of primordial importance to develop tools for the finding of these levels in a meaningful and yet simple way.
Dr.Widner attempted to achieve this with his indicators by using a “fractal” concept in which a support or resistance level is assumed to exist if the high or low within a given number of previous periods is the highest or lowest point of a larger number of periods. On his classic indicator definitions he uses the high or low of the fourth bar in the past, assuming this is a new support or resistance level if it is the highest point of the past nine periods from the current bar. In this way he established meaning by defining a resistance and support as the tip of fractals within a given number of periods.
–
After defining what is support and resistance he then found himself with the problem of having a very large number of defined levels as time evolved. In order to surpass this problem Dr.Widner used a simple array which only used the last 6 discovered levels meaning that only 6 support and 6 resistance levels would be used for trading. As new levels were discovered they would “bump” old ones outside of the array, making sure that a manageable and small amount of levels is the only available data.
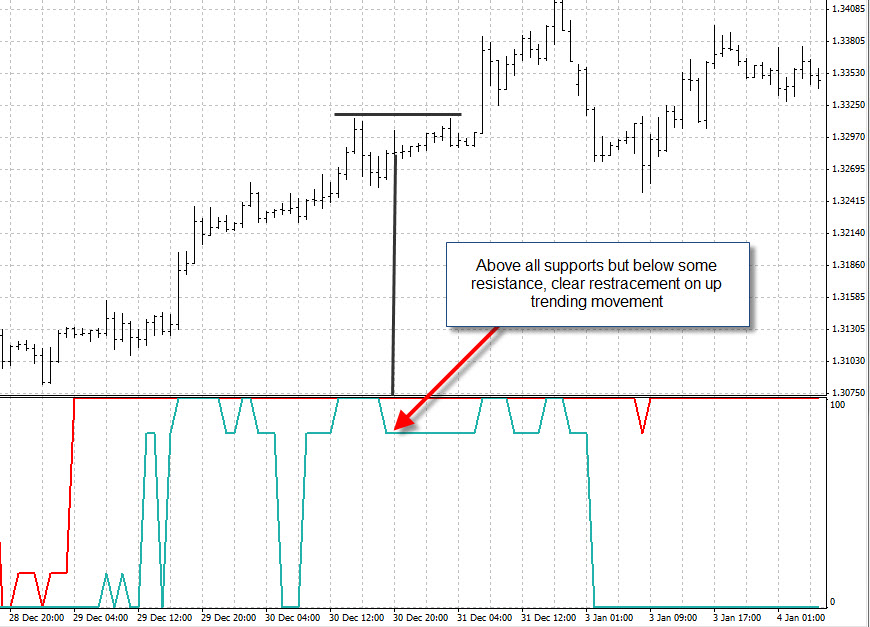
Once you have a set of S&R levels it becomes important to define some sort of criteria around them to make trading decisions. With this in mind Widner developed the WSO and WRO oscillators which are two simple indicators which oscillate between values of 0 and 100. When an indicator reaches 0 it means that we are currently below all levels while a value of 100 indicates we are above all levels. For example if the WSO indicator has a value of 100 and the WRO indicator a value of 50 it means that we are above all support levels but only above half of the resistance levels. This would be interpreted as being within a retracement of an up trending movement since we are above all supports but below some resistance (meaning we have retraced from a high).
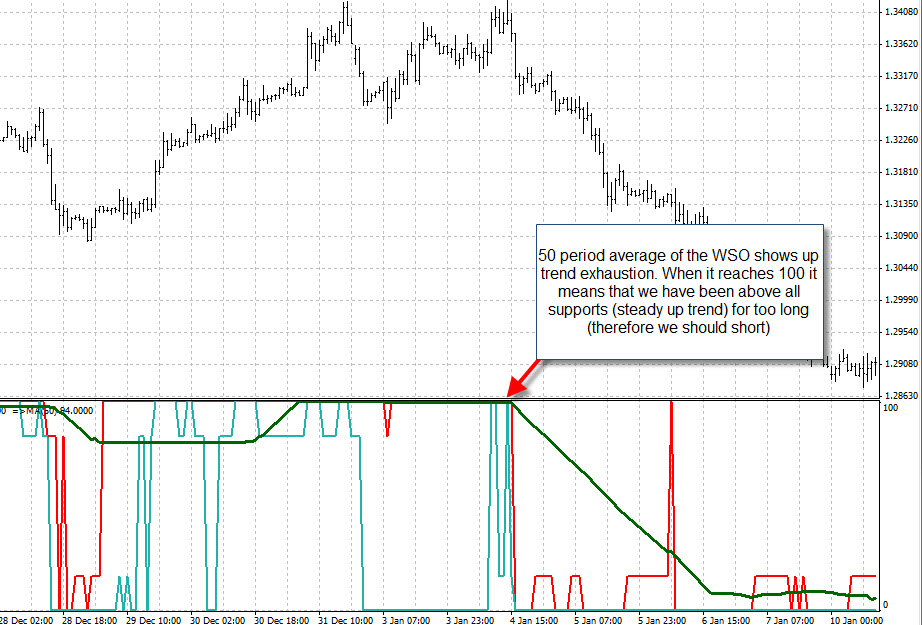
There are many creative ways to trade the WSO and WRO with the most popular being the use of some moving average calculated on the indicators. When you calculate an MA over the WSO or WRO indicators you get valuable information since you know if – on average- you have been above all resistance or below all support levels, allowing you to take trade following decisions with a good degree of robustness. Another very good way to use this indicator is to use longer periods to draw the fractals, something which gives you the ability to see were you are relative to different “peak levels”. Perhaps the most interesting use of this indicator is when it comes to multiple time frames since the indicators can give you a good idea of what types of movements are being developed within the long and shorter time frames.
–
–
I have known about the WSO and WRO indicators for about 2 years and although several of the systems I have developed with them have some potential, the problem of S&R level relevance always starts to show up. The weakness of the WSO and WRO oscillators relate to the fact that S&R relevance is simply measured through very recent history (without taking into account all previous trading) something which is vital to take into account how strong or weak resistance might be. However it is true that the WSO and WRO indicators can be used for the development of some simple trend following strategies with relatively good success levels, especially when used on the daily time frames where support and resistance levels are much more relevant. Since there seems to be no free MT4 version of these indicators online I decided to code a simple version which might be useful for those of you interested in giving this indicator a test. You can download this free version here.
If you would like to learn more about my work in automated trading and how you too can learn how to create your own automated trading systems based on understanding and sound trading tactics please consider joining Asirikuy.com, a website filled with educational videos, trading systems, development and a sound, honest and transparent approach towards automated trading in general . I hope you enjoyed this article ! :o)


Could you do a video that explains how you draw your S/R levels on your newsletter?
Hello Ekreitzer,
Thank you for your comment :o) Sure, I’ll do one within the next two weeks !
Best Regards,
Daniel