The main problem when finding systems through a data-mining approach (intensively searching for strategies using a computer) is to distinguish a strategy that is based on a real historical inefficiency from a strategy that reached its level of profitability just by random chance. As the amount of strategies you explore becomes larger, the likelihood that you find something good just out of chance becomes higher. Due to this problem it is fundamental to find ways in which you can test whether what you have found is actually meaningful (this was the subject of my last post). After polishing this analysis, I then become interested in looking at how the probability to find a profitable system out of chance differed across different Forex trading pairs, attempting to understand how the overall structure of different pairs may play a role in the actual probability that a finding is meaningful.
–
–
The process to find whether a system comes from random chance or not involves the building of a baseline distribution of systems found on randomized data (data created from the real data using a bootstrapping procedure with replacement), after this is done you must then compare the probabilities to find systems with a certain scoring variable with systems found on your real data to see with what confidence you can say that a system within a given class does not come from luck. Clearly the probability that something comes from randomness is derived directly from the probability that a profitable system within some characteristics is found on the random data and this is precisely what is different between different Forex pairs. Different price series are more or less vulnerable to just giving systems out of random chance, because their price structure allows for this to happen.
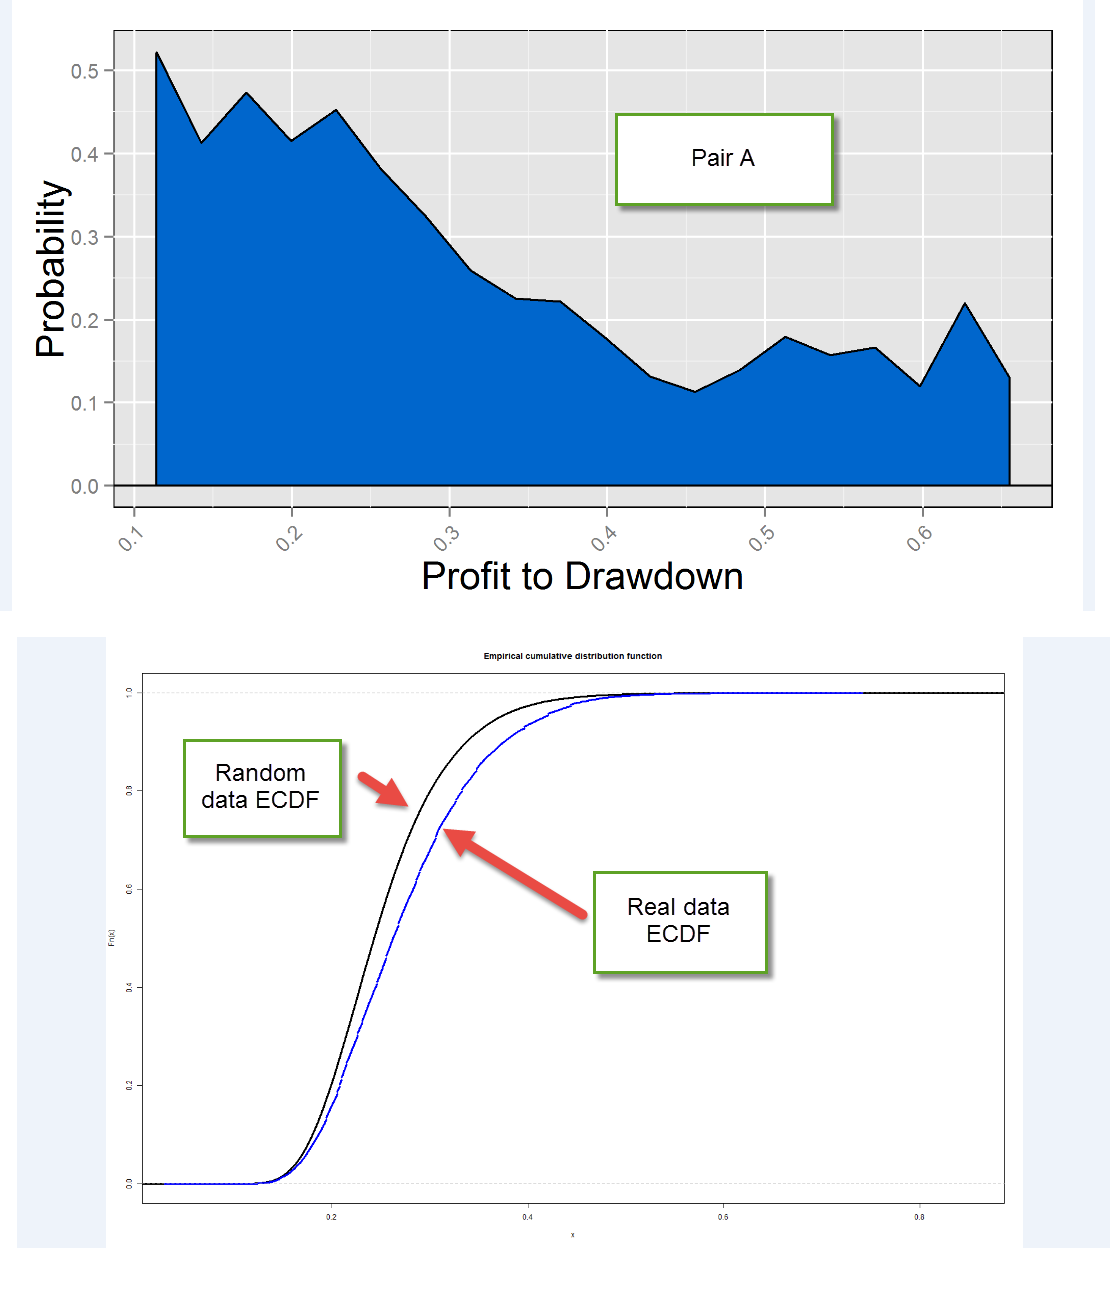
For the results on this article I used a limited 2 rule system creation space with shift variations between 1 and 50 in 5 shift steps, however the conclusions were the same for several different configurations. I also used daily data from 1986-2014 for all the pairs tested, the identity of the pairs was also hidden through the tests to avoid bias from my previous experience (I will refer to them as A, B and C). As it is showed on the image above, the A pair results show that we can say with a high confidence that systems with high profit to drawdown ratios (the scoring statistic) have a real historical profitability that is not derived from random chance (probability of coming from random chance near 0). This means that finding such highly profitable systems out of randomized time series is extremely hard and therefore the probability that we’re making a mistake in assuming that this profitability comes from a real phenomena is close to zero (note that there is a final point on the graph near 0 which is hard to see on the image above).
–
–
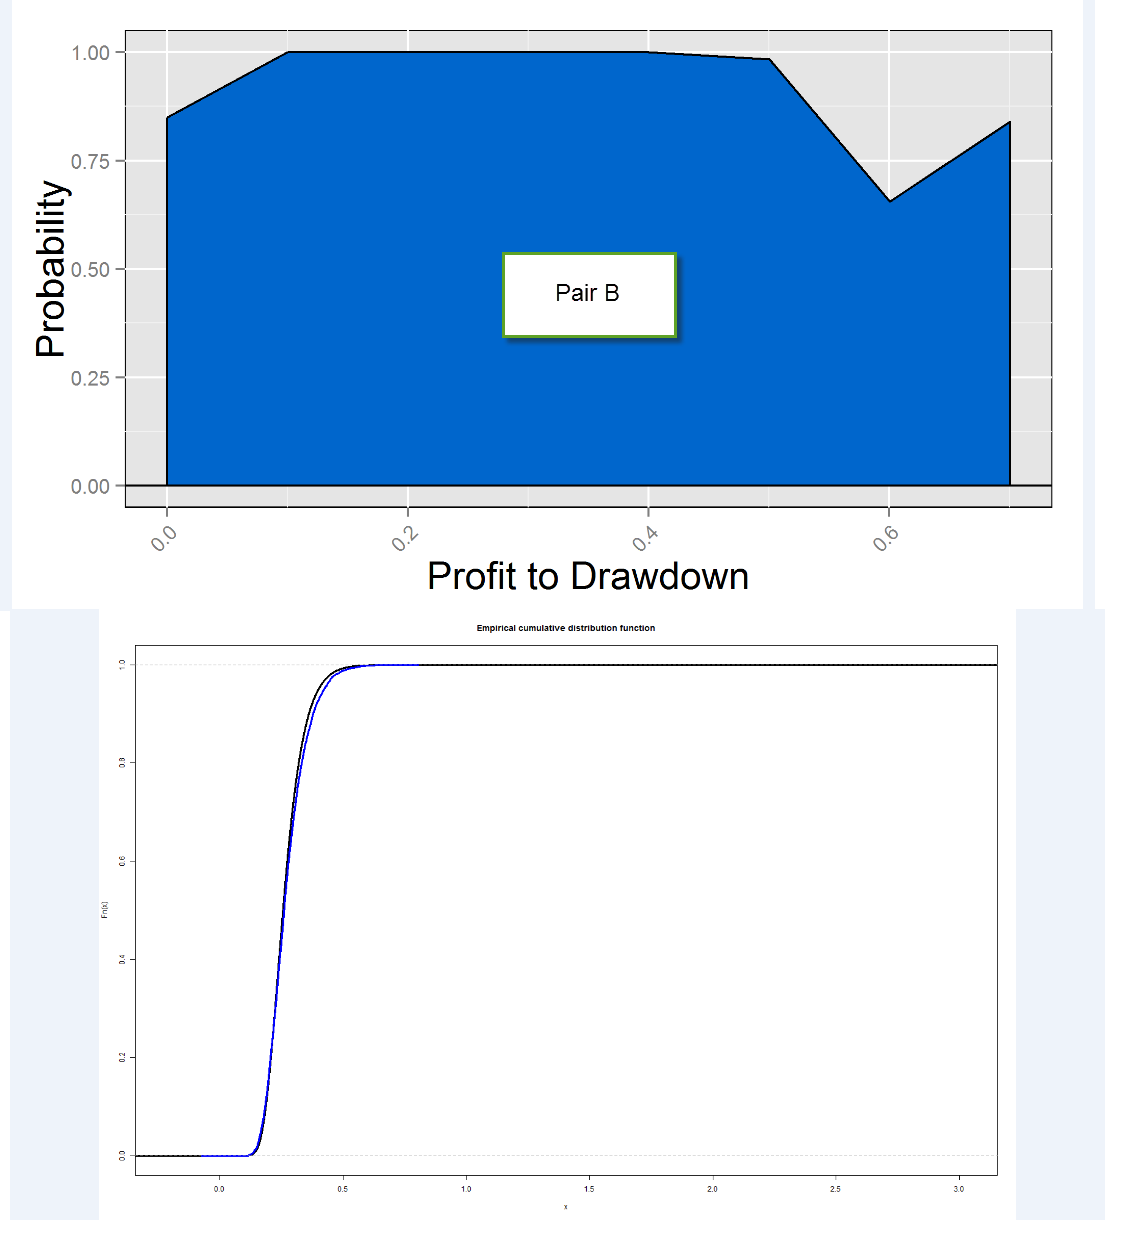
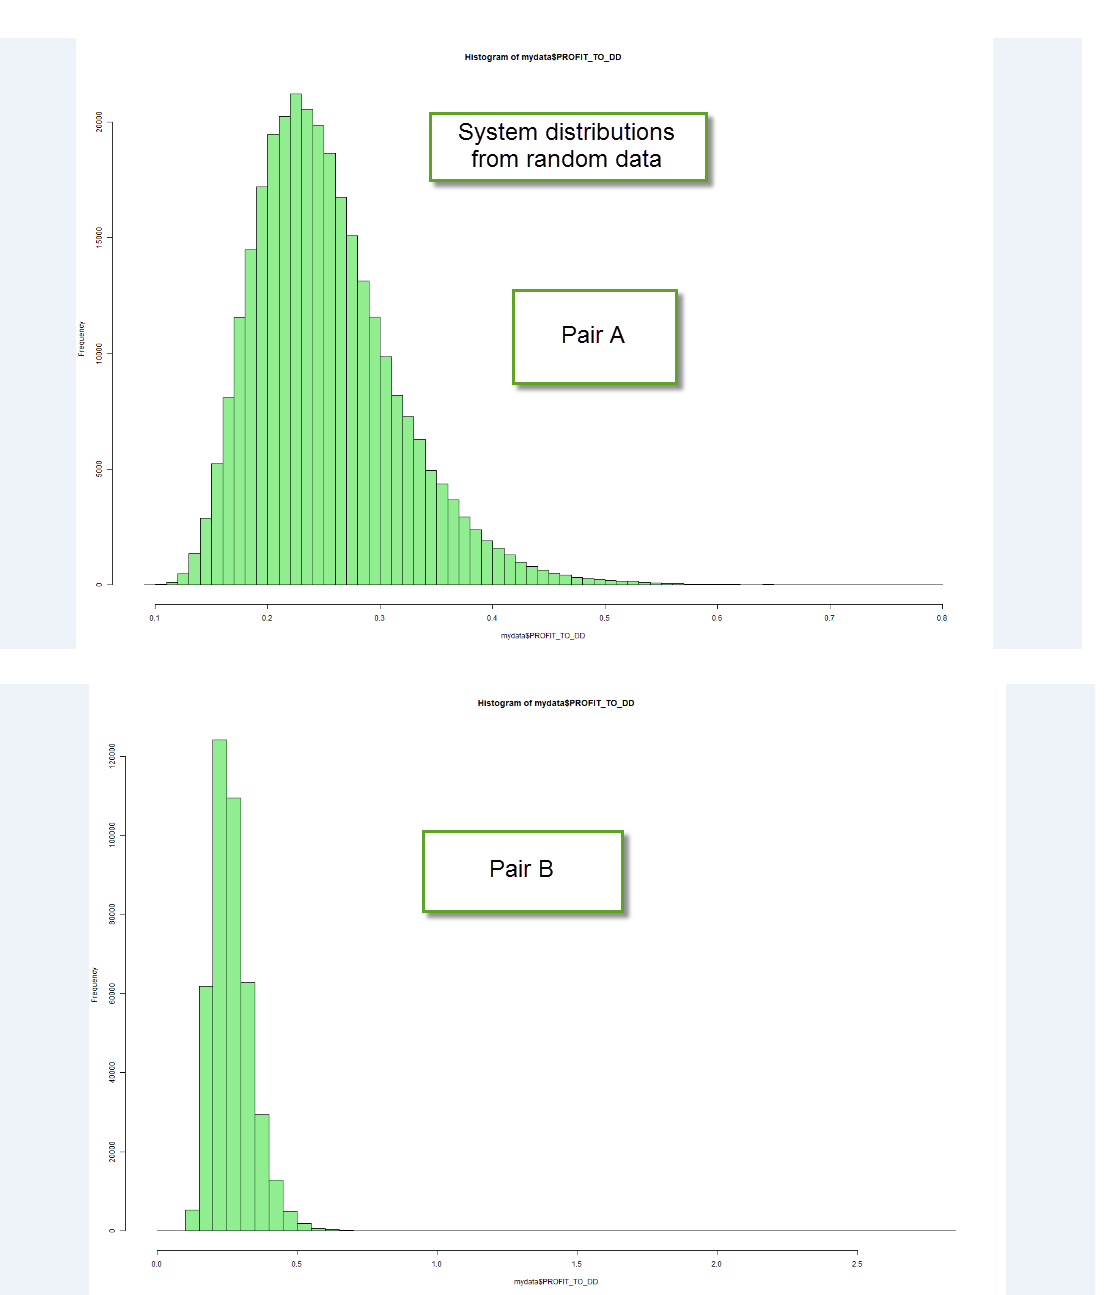
However when you look at other pairs – for example the B pair – the picture changes quite dramatically. In pair B the difference between the random system distribution and the real system distribution is very small (look at the ECDF) and therefore the probability that our systems come from random chance is significantly higher. Notice also how the probability to come from random chance also drops at high scoring statistic values, but it actually does not drop nearly as much as on the first case. A first probable cause of this phenomena might be that finding systems that are randomly profitable in random series coming from pair B is more probable, but the distribution of systems derived from random series shows that this is actually not the case (much more profitable systems are found on A random series). The difference is actually due to the number of systems for each scoring class that are found on the real data. On the real data the A series simply has a much more prominent population of profitable systems compared with the overall probabilities on random data, while on the B series the real data just looks like any other random series.
These observations are very important, because it means that not all symbols are the same when attempting to build strategies. Although in this particular case symbol A seemed to have a much better chance to lead to non-random systems than symbol B, it might be the case that upon changing the timeframe or other generation variables, pair B would show more favorable behavior towards random chance (in my experience the timeframe is the most important variable, others have little effect on these curves). The comparison between a pair’s randomly generated system distribution and the distribution of real systems depends heavily on the pair/timeframe being used and therefore it is fundamental to perform this analysis in order to guide the data-mining process in a manner that is more likely to lead to successful outcomes.
–
–
This also shows why predicting which symbol will lead to a lower likelihood from randomness is difficult because this variable depends on a significant number of factors. It depends on how easy it is to find systems on the randomized data (where long term bias on pairs might play a significant role) but it also depends on how easy or hard it is to find systems within the real data. An instrument might be heavily biased but if the real data is able to show a large enough population on a class-by-class comparison with the random data, then it means that – despite this bias – systems with inefficiencies coming outside of randomness might also be present. You can also have symbols where no long term bias exists but where the finding of profitable results on the real data is just as hard as on the random data (therefore the probability of systems coming from random scenarios remains high as well).
With this generic procedure for the evaluation of data-mining bias we can now perform systematic tests across different symbols and timeframes that will help us better guide our generation efforts to avoid wasting time on pairs/timeframes where we cannot draw clear distinctions between systems that come from randomness and systems that rely on true historical inefficiencies. If you would like to learn more about data-mining and automatic system generation please consider joining Asirikuy.com, a website filled with educational videos, trading systems, development and a sound, honest and transparent approach towards automated trading in general . I hope you enjoyed this article ! :o)


Hi Daniel,
seems you silenced your critics ;-)
I wonder about one thing in this article, how exactly you generate your random timeserie? Is it uniform?
Another question, how far is your progress on intra day strategies? I assume these are easier to generate now with your GPU tester..
Keep it up,
greetings
Hi Fabs,
Thanks for posting :o) I don’t really mind the critics, anyone is always welcome to post in an amicable and respectful manner. Let me now answer your questions:
Random time series are generated by bootstrapping with replacement, the typical procedure used when you want to generate a distribution for a sample statistic from a given distribution.
I have done some tests now since the GPU tester is much faster. As far as I can tell there are some interesting things, but simulations still take hours, so I am still doing data-mining bias determinations on the 1H to start exploring this further. Definitely you can generate systems on the lower timeframes with this tester, at least you can do so within computationally realistic times with a high-end GPU.
I hope this answers your questions :o)
Best Regards,
Daniel
Its getting quiet :-|
How is it going?
I agree… without Bob / fd / Fabio, it gets dull. Anyone out there, ready to animate the discussion with some challenging points, like in the previous posts? ;-)
Thanks in advance!
Hi Fabs,
Everything is good :o) It’s just taking a long time to draw conclusions from data-mining now that we are doing much more extensive bias evaluations. Expect some posts soon!
Daniel
It’s a well known fact that “good trading is boring” and this saying is confirmed by almost all profitable traders. In the algorithimic trading even if emotion is still there, but there is a less degree of involvement compared to discretionary trading (i.e. not all day in front of a screen). So what remains as the creative part of the job in mechanical trading is the discovering and building of strategies. Instead trading strategies extracted from data-mining despite a good chance of being profitable make the whole matter even more boring. To thrill and excite there still exist poker & roulette. But that’s another story.