From the many different types of statistical arbitrage available, pairs trading is perhaps one of the most popular. In pairs trading a trader will attempt to exploit the linear relationship between the values of two instruments, attempting to buy/sell them when the relationship between their values increases/decreases to values that offer enough profit potential. However pairs trading does not only require a linear correlation to exist but it also requires the instruments to be cointegrated, a fundamental property that ensures a fundamental connection between the instruments that diminishes the probability of the spread between both instruments “blowing up” (widening far beyond what is statistically expected). Although pairs trading is usually described in stocks/commodities, we rarely see any study of cointegration in the FX market. Today we’re going to look at some potential cointegrations in the FX market, why they exist and how they might be exploited.
–
–
Let us begin by defining what we mean by cointegration. Two series are cointegrated when they share a common stochastic drift. The typical example to explain cointegration talks about a man who goes to a bar with his dog. After getting drunk and leaving the bar both the man and the dog walk the same path home, although their stochastic drift – which is the random way in which the man walks and the dog wonders along the way – are different. When this happens their paths are in fact correlated but they are not cointegrated. If the man instead decides to put a leash on the dog their paths become cointegrated because they now share a common stochastic drift that is determined by the length of the leash. The man and the dog cannot be separated further than their leash allows, which makes any random movements they make beyond a certain length common to both (as they would pull on each other). In statistics we can evaluate for cointegration using several different tests from which the Augmented Dickey-Fuller (ADF) test is most popularly used. Note that this test evaluates only stationarity – not exactly cointegration – so another test such as a Johansen test is necessary to confirm cointegration.
When looking at classic examples of cointegration in financial time series you’ll notice that instruments that are cointegrated generally have some strong fundamental reasons to be cointegrated. The “leash” is a fundamental relationship between both instruments, their common stochastic drift. This relationship is usually very strong, for example two oil producing companies that share refineries in broadly the same countries and have the same clients, they are so tightly put together that it is very improbable for any random event to affect one without affecting the other. This is what makes deviations so tantalizing to exploit. In Forex however, the story is a bit different because countries have a very hard time being so fundamentally similar.
–
–
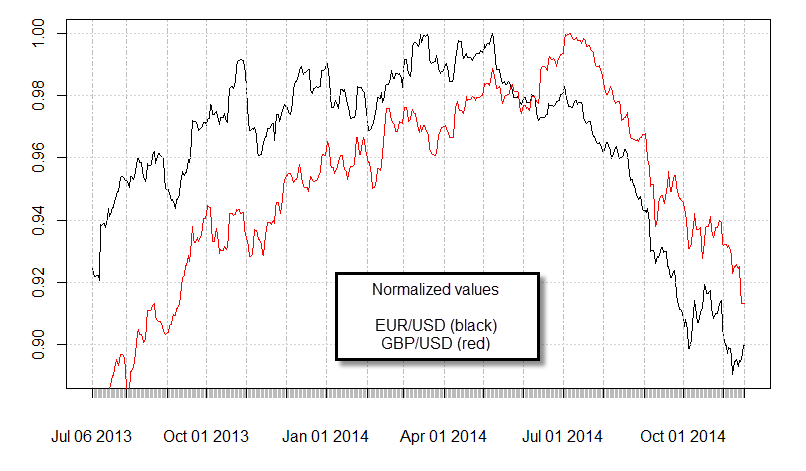
You can actually see this easily when you look at the last year of data for several FX pairs that we usually view as correlated. For example the EUR/USD and GBP/USD traditionally have a large correlation. A normalized plot showing the last year of data shows you that both pairs indeed tend to move in the same direction but it is clear that this relationship does not follow the same stochastic drift. An ADF test using the last year of data for these two pairs will give you a value of 0.28 which is simply far too large to reject the null hypothesis. Looking at other similar pairs reveals very similar results, pairs like AUDUSD|NZDUSD – which are even more correlated than the EURUSD|GBPUSD turn out to also not be cointegrated.
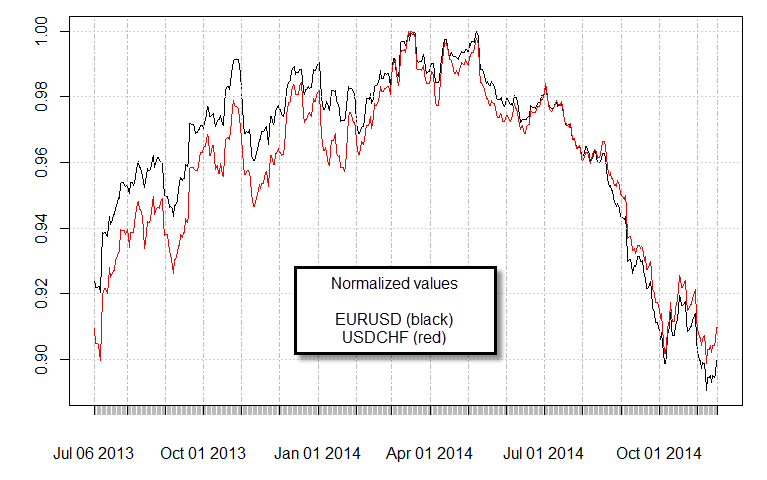
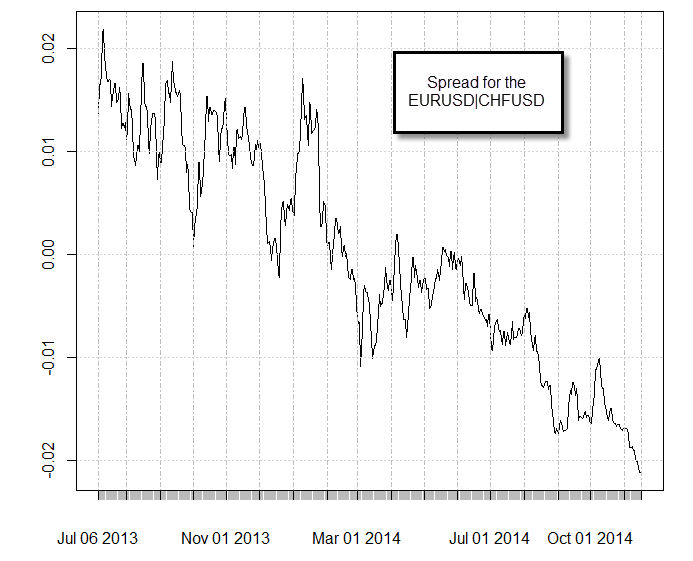
So are there any cointegrations in the FX market? Actually the answer is yes. The Swiss National Bank’s decision to create a floor on the EURCHF at 1.20 generated a “leash” that made several pairs share a stochastic drift. For example the EURUSD and the CHFUSD are now cointegrated due to this fact. An ADF test will give you a value less than 0.01 for this pair, suggesting that they are indeed cointegrated (confirmed by the Johansen test as well). All similar CHF containing pairs also show cointegrations, such as the EURJPY|CHFJPY and the EURAUD|AUDCHF. This cointegrations all arise from the EURCHF peg, something which is evident when you look at the spread value as a function of time between any of these pairs. The third image shows you the spread of the EURUSD|CHFUSD pair as a function of time, it is no surprise that this is the exact same graph as the EURCHF for the past year. As the length of the “leash” varies, so does the value of the spread on the cointegrated pairs.
–
–
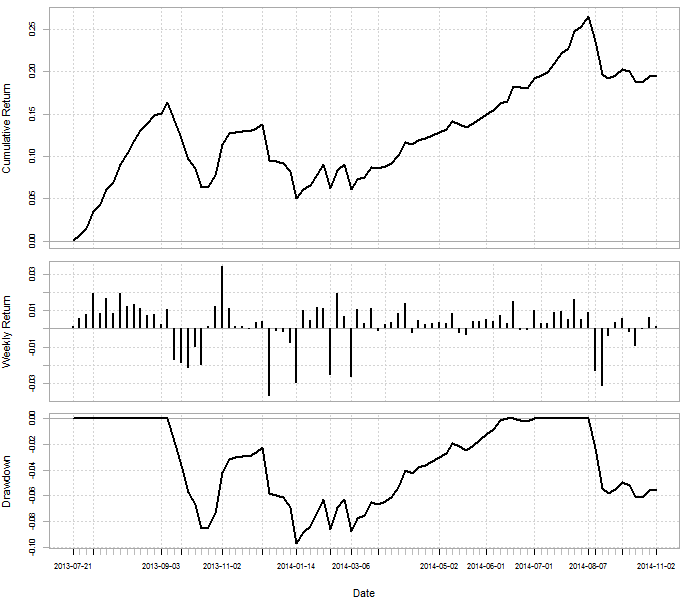
Could we take advantage of these cointegrations? Well, you certainly can. There are several ways in which cointegration can be traded but with a varying “leash” a good way is probably to trade the bollinger bands around the spread. You can trade on any timeframes but even when trading the daily timeframe you can make some money. The fourth image shows a very simple simulation in R where I traded the 3 pairs mentioned above,using 1:10 leverage, on a 10 period moving average using 1 standard deviation for band distances. The simulations show a 25% profit with a 10% drawdown within the past year, not too great but not too bad either. It is possible that further refinements and entries/exits on lower timeframes can indeed increase these margins.
–
–
One important thing to remember here is that the leash is a peg from a central bank. If this peg for some reason stops existing it is possible that this cointegration will simply vanish. It is therefore advisable to keep an eye on fundamental developments and stop trading the cointegration if this arises. It is also important to constantly repeat the statistical tests for cointegration as new data comes in so that you can stop trading any of these pairs as soon as the cointegration does show to break. If you would like to learn more about FX trading and how you too can design your own trading strategies please consider joining Asirikuy.com, a website filled with educational videos, trading systems, development and a sound, honest and transparent approach towards automated trading in general . I hope you enjoyed this article ! :o)


” In statistics we can evaluate for cointegration using three different tests from which the Augmented Dickey-Fuller (ADF) test is the most popular.”
Yo, this is a stationarity check. it does not imply cointegration.
This is true, however when the result of this test is positive for financial series they are always cointegrated, this is why it is so popularly used for this purpose I believe. You can however perform a Johansen test as well or a Engle–Granger two step test. In the examples used on this article all series that pass the ADF test also pass the Johansen test, showing they are cointegrated.
i will be more than happy if you could share your r code in order to learn how to do this process
Thanks
Spread trading on EURUSD|CHFUSD sounds equivalent to trading EURCHF itself, which, as is actually directly possible at most brokers, should be preferred (pay only half the spread/commission costs). An EURUSD|CHFUSD spread is in fact a synthetic instrument for EURCHF.
So how is this spread trading any different (for the better)?
Thanks for commenting :o) You’re clearly right, it’s the same as trading a bollinger band strategy on the EUR/CHF. As mentioned on the article the spread is actually the same chart as the EUR/CHF. The cointegration of the EURUSD|CHFUSD is actually reflected as a tendency to return to the mean on the EUR/CHF. If you were going to trade this in practice you would indeed use the EUR/CHF to save trading costs instead of buying/selling EURUSD and USDCHF.
Great article overall but confusing in some places. As one comment’or has pointed out, ADF test is a unit root test. It is a formal test used to establish whether a price series is stationary or not. If you get a P value of more than 1%, 5% or 10% you can only fail to reject the null of unit root based on the significance level you are comfortable with. This does not infer the presence of co-integration.
The power of the ADF is also documented to be low so most researchers now go ahead to cross check with a complementary test such as KPSS.
It will be interesting to see the R code so we can also run it and see the results. You do mention that the Johansen test confirms the presence of co-integration, so all in all I believe your findings are on solid ground.
Some interesting questions that come up is how stable is the co-integration relationship? How frequently does the long run relationship estimate change and how big are these changes when they do occur.
Overall great article, keep them coming and do share some R code.
Regards,
Liftoff