Although I stopped using Metatrader 4 for my personal trading and business almost two years ago it is still true that most people who start in Forex automated trading continue to use this trading platform. One of the most important limitations that you encounter when using MT4 for back-testing – at least one that I found most frustrating – was the lack of flexibility in the information that you can obtain and the difficulty that you have in manipulating the data that comes out of the program after you run a backtest. On today’s post I am going to show you how you can overcome this limitation so that you can take your MT4 backtesting reports, turn them into properly formatted csv data and load them into R in order to better analyse your trading system and get a much clearer picture of how your system performs. You can download this zip file containing the script and a sample back-testing report to process.
–
#!/usr/bin/env python
# Created by Daniel Fernandez
# http://mechanicalforex.com 2015

import csv
from bs4 import BeautifulSoup

def main():

    with open ("test.htm", "r") as myfile:
        s=myfile.read()

    soup = BeautifulSoup(s, 'html.parser')
    table = soup.find_all('table')[1]

    f = csv.writer(open("test.csv", "w"))
    f.writerow(["Time", "Type", "Order", "Size", "Price", "SL", "TP", "Profit", "Balance"])

    # variable to check length of rows
    x = (len(table.findAll('tr')) - 1)

    # set to run through x
    for row in table.findAll('tr')[1:x]:
        col = row.findAll('td')
        Time = col[1].getText()
        Type = col[2].getText()
        Order = col[3].getText()
        Size = col[4].getText()
        Price = col[5].getText()
        SL = col[6].getText()
        TP = col[7].getText()
        try:
            Profit = col[8].getText()
            Balance = col[9].getText()
        except:
            continue

        lineToAdd = (Time, Type, Order, Size, Price, SL, TP, Profit, Balance)
        f.writerow(lineToAdd)


if __name__ == "__main__": main()
–
The Metatrader platform does not offer you any processing-friendly formatting after you run a strategy backtest. You obtain an htm based report that contains all your system’s signals and positions but you have no easy route to take this information and load it in a program like R. The python script presented above allows you to take these MT4 results and process them to generate a csv file that contains balance change information that can be loaded directly into R. The script requires installation of the bs4 python library and works with python 2.7. In order to use this script simply change the “test.htm” with the path to the htm from the MT4 backtesting report you want to process. After this you will see a file called “test.csv” (you can change that name too) created within the script’s folder.
After we have created the csv file with the balance changes we can now load that data into R to get some cool statistical analysis and graphs for the strategy. The code below shows you how you can load the above generated csv file into R. The code needs you to have both the quantmod and PerformanceAnalytics libraries installed within your R setup. What the code is doing is simply to load the data into a zoo object which is then turned into an xts, we then obtain monthly returns using the monthlyReturn function (it can be daily or weekly if you wish as well) to obtain the two main performance graphs we want to see. Note that the rollingPerformance graph will not work properly on a frequency lower than monthly.
–
library(quantmod)
library(PerformanceAnalytics)

resultsTEMP <- read.zoo("/pathToFile/test.csv", sep = ",",format="%Y.%m.%d %H:%M", header=TRUE,index.column=1,colClasses=c("character", "NULL", "NULL", "NULL", "NULL", "NULL", "NULL", "NULL", "numeric"))
results<- as.xts(resultsTEMP)
monthly <-monthlyReturn(results)
charts.PerformanceSummary(monthly, ylog=TRUE)
charts.RollingPerformance(monthly)
–
–
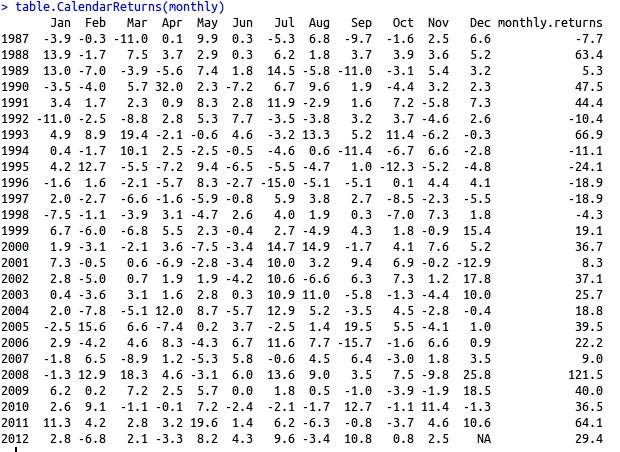
The above two plots give us a lot of additional information compared to the simple MT4 back-testing report. We can see the rolling window evolution of Sharpe ratio, standard deviation and past 12 month returns as well as the drawdown periods and monthly returns of our trading strategy. The depth, duration and general presence of drawdown periods become quite evident while they are very difficult to see on pure return graphs, especially if you have a compounded system (like the above) where the lack of a logarithmic y axis in MT4 makes the interpretation of results much harder. Additionally you can also use functions like table.CalendarReturns (only works correctly over monthly returns) which shows us the average, yearly and monthly returns for the strategy for the entire back-testing period (see an example below).
–
–
However the most important thing that you gain by doing this is a complete freedom in the statistics you can calculate and how you can analyse the results of your trading strategies. Having your data in a format that is readily accessible by a significant number of R libraries and having the entire power of the PerformanceAnalytics library at your disposal means that you won’t be constrained by the very limited data that the MT4 platform chooses to give you. Furthermore you also avoid depending on any third party software and can get any additional statistics you wish out of your results. If you would like to learn more about my work in automated trading and how we develop, analyze and trade strategies in and outside of MT4 please consider joining Asirikuy.com, a website filled with educational videos, trading systems, development and a sound, honest and transparent approach towards automated trading.


