During the past month I have been doing some rather intensive research in the application of the fractal dimension to draw information from financial time series. Although I had spoken about its use in an efficiency index before I have now decided to take a look into the use of the sole fractal dimension as a means to attempt to predict the potential for system abundance among different Forex pairs. Today I want to share with you some of the progress that I have made in this direction and why I have found this to be a better predictive tool than other attempts I have made before using efficiency indexes and entropy calculations. I will also talk about some of its potential short comings and how I intend to improve its usefulness. The 1986-2016 Forex historical data needed to reproduce these results is only available to Asirikuy members.
–
library(pracma)
library(quantmod)
library(fractaldim)
library(ggplot2)
library(e1071)

calculate_EI <- function(fxdata){

  colnames(fxdata) <- c("data")
  EI <- c()

  fractal_dimension_for_symbol <- fd.estimate(as.data.frame(fxdata$data)$data, method="hallwood", trim=TRUE)$fd
  fractal_dimension_for_symbol <-fractal_dimension_for_symbol+ fd.estimate(as.data.frame(fxdata$data)$data, method="boxcount", trim=TRUE)$fd
  fractal_dimension_for_symbol <-fractal_dimension_for_symbol+ fd.estimate(as.data.frame(fxdata$data)$data, method="periodogram", trim=TRUE)$fd
  fractal_dimension_for_symbol <-fractal_dimension_for_symbol+ fd.estimate(as.data.frame(fxdata$data)$data, method="incr1", trim=TRUE)$fd
  fractal_dimension_for_symbol <-fractal_dimension_for_symbol+ fd.estimate(as.data.frame(fxdata$data)$data, method="variogram", trim=TRUE)$fd
  fractal_dimension_for_symbol <-fractal_dimension_for_symbol+ fd.estimate(as.data.frame(fxdata$data)$data, method="rodogram", trim=TRUE)$fd
  fractal_dimension_for_symbol <-fractal_dimension_for_symbol+ fd.estimate(as.data.frame(fxdata$data)$data, method="madogram", trim=TRUE)$fd
  fractal_dimension_for_symbol <-fractal_dimension_for_symbol+ fd.estimate(as.data.frame(fxdata$data)$data, method="variation", trim=TRUE)$fd
  fractal_dimension_for_symbol <- fractal_dimension_for_symbol/8

  EI$value <- 1.5-fractal_dimension_for_symbol

  if(EI$value < 0){
    EI$value = 0.0
  }

  return(EI)
}

symbol.set = c("EURUSD","AUDUSD","GBPUSD","EURJPY","GBPJPY","USDJPY","USDCAD","EURCAD","USDCHF","EURAUD","AUDCHF","AUDCAD","GBPAUD","CHFJPY","CADJPY","EURCHF")

allSymbolEntropies <- data.frame(matrix(NA, nrow = length(symbol.set) , ncol = 2))
colnames(allSymbolEntropies) <- c("symbol","entropy")

for (x in 1 : length(symbol.set)) {
  path <- paste("/backtesting_data/", symbol.set[x], "1987_60.csv", sep="")
  fxdatatemp <- read.zoo(path, sep = ",",format="%d/%m/%y %H:%M", header=FALSE,index.column=1)
  fxdata<- as.xts(fxdatatemp)
  colnames(fxdata) <- c("open", "high", "low", "close", "vol")
  fxdata <- (fxdata$open-min(fxdata$open))/max(fxdata$open)
  cat("loading", symbol.set[x] , '\n')
  allSymbolEntropies$entropy[x] = calculate_EI(fxdata)$value
  cat(allSymbolEntropies$entropy[x], '\n')
}

allSymbolEntropies$symbol = symbol.set

allSymbolEntropies <- allSymbolEntropies[order(allSymbolEntropies$entropy),]
allSymbolEntropies$symbol <- factor(allSymbolEntropies$symbol, levels = allSymbolEntropies$symbol, ordered = TRUE)

ggplot(data=allSymbolEntropies, aes(x=symbol,y=entropy)) +
  geom_bar(fill="blue", width=.8, stat="identity") +
  guides(fill=FALSE) +
  xlab("Pair") + ylab("1.5 - Fractal Dimension") +
  ggtitle("Fractal Dimension values")+
  theme(axis.text.x = element_text(angle = 90, hjust = 1))
–
So far in my attempts to predict the number of systems that can be found through system mining in Forex pairs I have come up with nothing useful. It seems to be very difficult to draw some relationship between the ability to extract historical inefficiencies and the data series itself as there seems to be no simple linear correlation with any of the standard statistical properties of the distribution of returns from the different time series. My attempts to use values that relate to the difference between a series and a random walk – such as entropy – have also left me empty-handed since there has been no relationship between values such as entropy or the Hurst exponent with the actual number of systems that are found when you attempt to perform a mining exercise. This is surprising since there should be some tell-tale sign on these symbols as – no matter what type of systems you try to mine for – you will always find more systems on some symbols compared to others.
My search using fractal dimensions was also coming up with nothing until I read this bachelor thesis on fractal dimensions and financial time series. The following paragraph was particularly interesting to me:
If 1.5 < F D < 2, then a time series is more jagged, it reverses more
often than random walk. It is an anti-persistent process, and if 1 < F D < 1.5,
then a time series is characterized by long memory process; it is persistent.
All events in the past impact all events in the future. In chaos theory, such
characteristic is called sensitive dependence on initial conditions. In nature,
persistent time series is the most common type, and as I will show later, fractal
dimension of financial time series should lie between 1 and 1.5, as they exhibit
long memory characteristic and correlations in time.
This reading made me immediately remember that fractal dimensions above 1.5 and below 1.5 are in fact extremely different types of time series, even though they are both deviated from random walks. It may well be that series with a fractal dimension above 1.5 cannot be profited from through the use of algorithms from the types I mine even though they are not random walks at all. This made me think that I may just want to look at symbols where the fractal dimension is between 1 and 1.5 and then I may want to rank those symbols by the magnitude of their deviation from this value. This may be a way to tell where it might be easy to mine trading strategies that work with this type of series.
–

–
In order to ensure that my results were not deviated due to the use of a specific estimator for the fractal dimension I calculated the fractal dimension value for each symbol as the average of all fractal dimension estimator outputs available in the R fractaldim library. Furthermore to be more careful I also normalized the price data for all symbols so that it was always bounded between 0 and 1. This in order to ensure that the different magnitude between the values of the symbols had no effect in the ending result although by the nature of the fractal dimension calculations this is not expected to make any difference. I also performed the analysis on 1H data which is the data we regularly use for the mining of trading strategies.
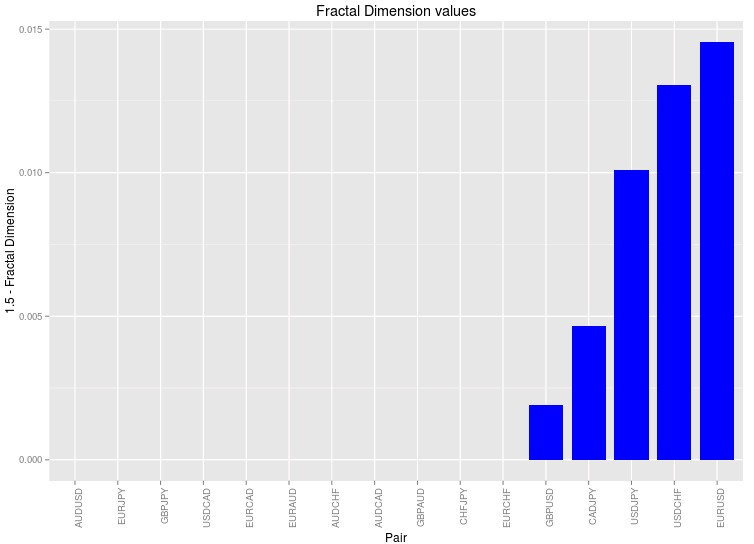
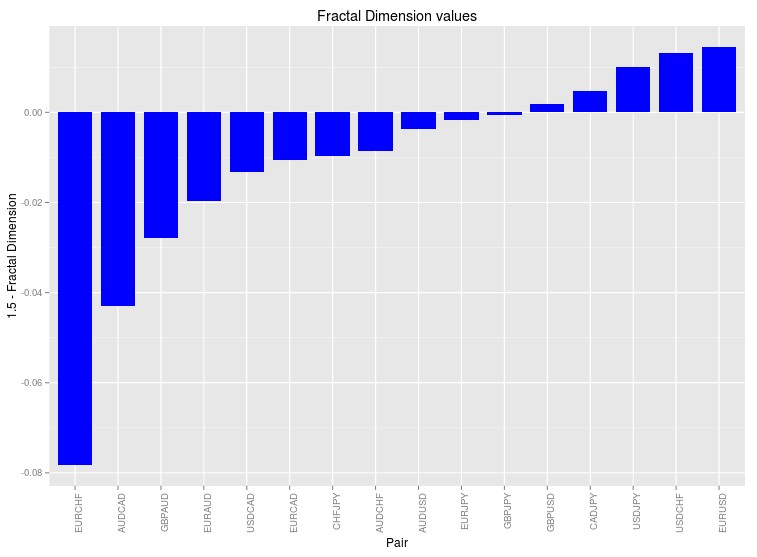
The results – showed above – are the first results I have ever gotten where the prediction actually follows what I see in real system generation. I often see that the EURUSD and USDCHF have the highest amount of systems found followed usually by the USDJPY and the GBPUSD. It is worth noting that the CADJPY symbol is also there while the EURJPY and GBJPY symbols are missing (these symbols also contain a significant number of strategies). I have never tried searching for strategies on the CADJPY so this experiment may point out that there might be some systems to be discovered there. Nonetheless it is also worth mentioning that this exercise assumes that the random data central point is 1.5 while it could be really higher or lower depending on the time series. In order to obtain better estimates it is important to generate random series using bootstrapping with replacement for each symbol and obtain an expected value for the fractal dimension in the absence of all inefficiencies within the data. This would be used as the central point instead of the 1.5 value I have chosen above. Introducing this correction might bring the EURJPY and GBJPY into the picture since their values are just slightly below 1.5 (as you can see in the graph below which includes below zero differences with 1.5).
–

–
It is also worth noting that some of the fractal dimension calculation methods also deviate the calculations significantly, for example the periodogram method gives some rather strange results, very different from those of all other methods including the box count, rodogram and hallwood estimators (which tend to agree with one another). It may well be that we need to use the correct set of estimators in order to obtain a realistic prediction. Of course from the above we have the prediction that the CADJPY should yield some systems, which we have to test in order to see if there is any substance to the above calculations or whether it is just a happy coincidence that the EURUSD appears to be the best symbol for system searching. Of course if you would like to learn more about trading system and how you too can build and trade your own algorithmic setups please consider joining Asirikuy.com, a website filled with educational videos, trading systems, development and a sound, honest and transparent approach towards automated trading.strategies


Daniel
Have you seen Parralax Research: http://www.pfr.com/pfr/articles.htm
http://www.pfr.com/files/ExtremeHurst_for_Bloomberg_Guide.pdf
I had never heard of them. Thanks for the links!