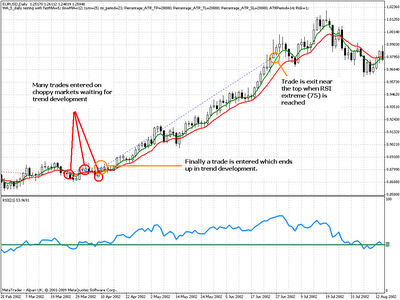
The funniest thing about long term trend following systems is that they are the easiest to develop, yet the least used trading systems. A very wide combination of indicators or price action based strategies can be used to follow trends on the daily time frames yet you almost never see anyone trading this kind of system. The problem here is mainly the length of the draw down periods which is often VERY long for this type of systems. Since the profitability of these systems is often based in “getting early into the trend” we are left with periods where there are many whipsaw signals that lead to even years of draw down or breakeven results. The systems are very successful, yet their use is psychologically very difficult.
One such system I have coded will be the objective of the rest of thist post. The system is nothing more than a fairly well known strategy using a 5 and 12 period EMA cross on the daily charts coupled with an RSI(21) condition that only lets the EA enter long trades when above 50 and short trades when below this value. This means that you will only enter long trades when more than 50% of the change of the last 21 bars has been towards the upside and vice versa. The EMA cross is simply the way to determine trend direction since a 5 EMA going above the 12 EMA means that price is reaching higher highs and the opposite means that price is reaching lower lows.
– –
–
Once you see an EMA cross (confirmed after close) and the RSI criteria matches you enter a trade which is exit when the RSI reaches the 75 level (for longs) and the 25 level (for shorts) or when an opposite entry signal arrives. This criteria actually allows us to exit trades near tops or bottoms since RSI levels on the daily charts rarely reach extreme values above 75 or lower than 25 due to the fact that this implies very sharp and sustained trends that are simply not sustainable for longer periods before important retracements or consolidation zones develop. The trade size used on each trade is determine by the daily 14 period ATR level which allows us to trade more in lower volatility and less in higher volatility. The same formula as for the turtle system is used here.
– –
–
Using this criteria – without any optimization – leads us to the results shown above for the EUR/USD (Jan-2001/Jan-2010, 2000 is not used due to the daily data needed for the calculations). As you see, the system achieves a very good overall profit level with a compounded average yearly profit to maximum draw down ratio of about 1:2 which – although far from perfect – is pretty decent for an initial development with absolutely no optimization whatsoever. The system then turns out to be a pretty powerful mechanism to follow trends on the daily time frames with minimum effort and analysis. If you are wondering if it works on other currency pairs, I am leaving that for a future post :o). Some mechanisms like pyramiding of positions may also be able to improve the system’s results, something which I am currently investigating.
If you would like to learn more about my journey in automated trading and how you too can build your own long term trend following systems based on sound trading tactics please consider buying my ebook on automated trading or joining Asirikuy to receive all ebook purchase benefits, weekly updates, check the live accounts I am running with several expert advisors and get in the road towards long term success in the forex market using automated trading systems. I hope you enjoyed the article !


