One of the key measurements used to judge whether two systems should be used together in a portfolio is the correlation of returns. This can tell you the degree in which two trading strategies are related and can help you avoid using two strategies that have had very closely related historical returns. However this measurement has some serious limitations that stem from the fact that the correlation analysis makes no distinction between positive and negative returns and mainly judges similarity by how both positive and negative returns relate with each other. On today’s post we will discuss why this can lead to the trading of systems that are very correlated in a way that we would want to avoid and how we can actually avoid this using a better measurement: the Losing Period Overlap Index or LPOI.
–

–
So what is the problem with the correlation measurement? Ideally what you want when you select two trading systems is not for them to be completely uncorrelated but what you want is for them to take losses at the same time as infrequently as possible. Most of us have no problem with systems making gains at the same time, while we would definitely want to avoid two systems that tend to drawdown together. The correlation measurement can view two systems that lose at the same time as having a low correlation if there are variations in the magnitude of those losses such that they do not follow exactly the same patterns.
Any statistic that attempts to improve on the correlation must acknowledge the fact that what we care about in general is not what the correlation measurement is assessing – overall match between returns – but what we care about is whether losses happen at the same time. To do this I propose the LPOI which takes the total number of losing periods of a trading strategy A and calculates how many of those periods overlap with losses in trading system B. The LPOI is therefore also normalized between 0 and 1, which values approaching 1 being worse and values approaching 0 being ideal.
–

–
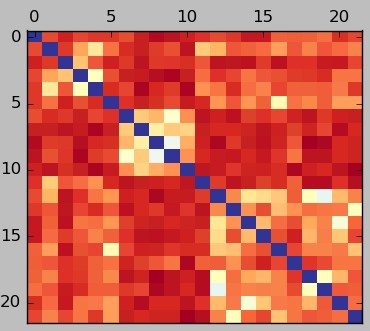
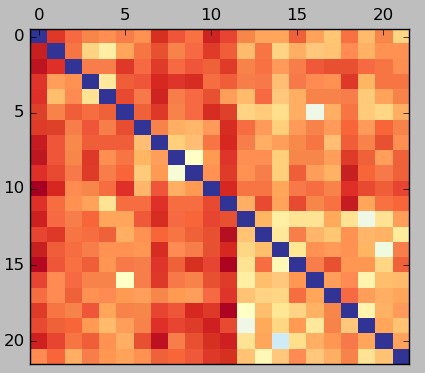
The first graph in this post shows a typical correlation heatmap – darker red values are more negative – while the second image shows the heatmap for the same strategies calculated using the LPOI. Both heatmaps were calculated using monthly returns. In the first image you can see that systems 5-10 have a very low correlation with systems 10-20 but what we can see in the LPOI plot is that when looking at matches between losing periods the relationship is not that good. The correlation analysis is telling us that the historical monthly returns are very loosely related while the LPOI is telling us that the specific relationship that interests us – the overlap in losses – is not improved so much compared to say, the relationship between systems 0-5.
The LPOI provides a much clearer vision of what combination of strategies might be better to trade together. Going for the lowest LPOI relationship means that we go for the lowest historical overlap between losing periods while going for the lowest correlation might well imply going for an average overlap in losses. The LPOI can therefore be considered a superior measurement in terms of trading system comparisons as it will yield portfolios that have systems that compliment each other in a much narrower and relevant definition compared to the general correlation calculation.
–

–
Currently the LPOI calculation is quite expensive computationally – at least the first trial implementation I made for this article – but I am now seeking to improve the code to make it fast and after that try it within our mining methods to see if we can generate portfolios that have better profiles as it pertains specifically to drawdown period reductions. I will certainly dedicate some future posts to the computational implementation of the LPOI and it’s effects in the outcome of trading portfolios. If you would like to learn more about portfolio building and trading please consider joining Asirikuy.com, a website filled with educational videos, trading systems, development and a sound, honest and transparent approach towards automated trading.strategies


Hi Daniel,
Thanks for the great post – I’ve personally always wondered if there were better ways to measure pairwise similarities between strategies, other than correlation.
Just thinking out loud here, but could there be a way to extend the idea to a whole portfolio of strategies? Perhaps the average LPOI measured pairwise for every strategy in the portfolio. Then such a measure can be used as the objective function when doing portfolio optimisation, so that we are directly minimising the average amount of “overlapping loss periods”. What are your thoughts on this?
Thanks
Another thought: we can weigh the LPOI by the magnitude of the losses within each period. We would care more about losing 30% in each strategy than losing 1% per strategy. So perhaps something like the sum of (loss of strategy 1 in period t) * (loss of strategy in period t) * (indicator function for both strategies losing at the same time), then normalised in some way to make the measure between 0 and 1
Hi Andrew,
Thanks for writing! The calculation is fairly complex from a computational stand-point as-is so I wouldn’t want to go into a much deeper over-complication of the matter (before judging the merit of the simplest implementation). My first point of study – besides making the calculation more efficient and adding it to qqpat – will be to determine whether there are weaker or stronger variations in the LPOI when going into new market conditions. If the LPOI varies more than simple correlation measurements then it might be in reality a worse, rather than a better way to select systems. Thanks again for writing!
Best Regards,
Daniel
Hi Andrew,
Thanks for writing! I am happy that you have found the post interesting :o) The real question – whether this will work for selection and portfolio construction – is if it yields a relationship that is more stable than the correlation measurement. The LPOI would be useless if a measurement then changes dramatically as market conditions shift so the first thing is to prove that it is in some sense “more permanent” than the simple correlation measurement. Once we get that we can then implement portfolio optimization efforts that use the metric. Thanks again for writing and reading the blog,
Best Regards,
Daniel
While it is true that correlated losses are felt more worrisome, optimizing for strategies with little negative correlation seems to be also prone to selection bias. Means, simply selecting stratgegies with the lowest negative correlation is probably not enough (same problem as the selection problem with performance regarding a single strategy).
This is my fear as well. No matter how you select systems you are always using some sort of historical comparison which is prone to variation along new market conditions. Therefore you do not eliminate the problem of over-estimating your statistics due to the fitting of historical relationships between systems. The LPOI measures something that interests us more, but the question is whether it is something more permanent than correlations along new market conditions.