What is the fractal indicator ? How is it calculated ? The fractal indicator is based on the formation of “arrow like” formations or “fractals” caused by a high or low being reached within a specific pattern within a certain candlestick formation. What the fractal indicators looks for to draw a fractal is a series of continuous highs or lows leading to a major high or low which is then retraced from by a series of higher highs (in case of a low) or lower lows (in case of a high). For example the following patterns would cause the formation of fractals :
Each line represents a bar of price movement :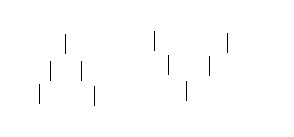 As you can see, the goal of the fractal indicator is to show “tops” and “bottoms” defined by the above close price patterns. However, also as you can see, the fractal indicator needs several bars to accurately show the pattern and no position should be entered before the fractal indicator has been drawn. The actual indicator in the metatrader 4 platform does not wait for the close of the last bar to show the fractal pattern so the indicator may show signals than then “disappear” if the last bar goes out of the fractal pattern when closing. This is solved by this fractal indicator which does not repaint and does wait for the appropriate closes before drawing the fractal.
Fractal indicators are useful in many aspects. They are commonly used as a way to look for support/resistance levels (several fractals are needed in order to confirmate this assumption) and they are also used to gauge a trend strength as the actual number of fractals broken by price gives a sense of “momentum”. However, fractals should never be used by themselves as they often give too many fake signals and no systematic way to trade “bounces” or “breakouts” can be formulated. Often a computer attempting to elucidate support and resistance levels with fractals will see a lot more than what a human trader would see, leading to further complications of trading methodologies involving this approach.
However, fractals may be useful in automated trading as a means to define a “ranging market” when the market fails to “break” above up and down fractals and therefore remains in a sort of “channel”. In my personal experience, the use of fractals in automated system is, to say the least, complicated since particularly volatile time periods usually generate a rather high number of “less meaningful” fractals which become a big problem when dealing with an automated system. However, combinations of the fractal and alligator indicators as used in Bill William’s system, coupled with an adequate dynamic adaptive money management system may generate a profitable system from fractal trading. Any willing to give this a shot would be welcome !
If you would like to learn more about automated trading system design and evaluation, particularly how these systems can in fact be traded profitably with adequate risk and profit targets please consider buying my ebook on automated trading or subscribing to my weekly newsletter to receive updates and check the live and demo accounts I am running with several expert advisors. I hope you enjoyed the article !


