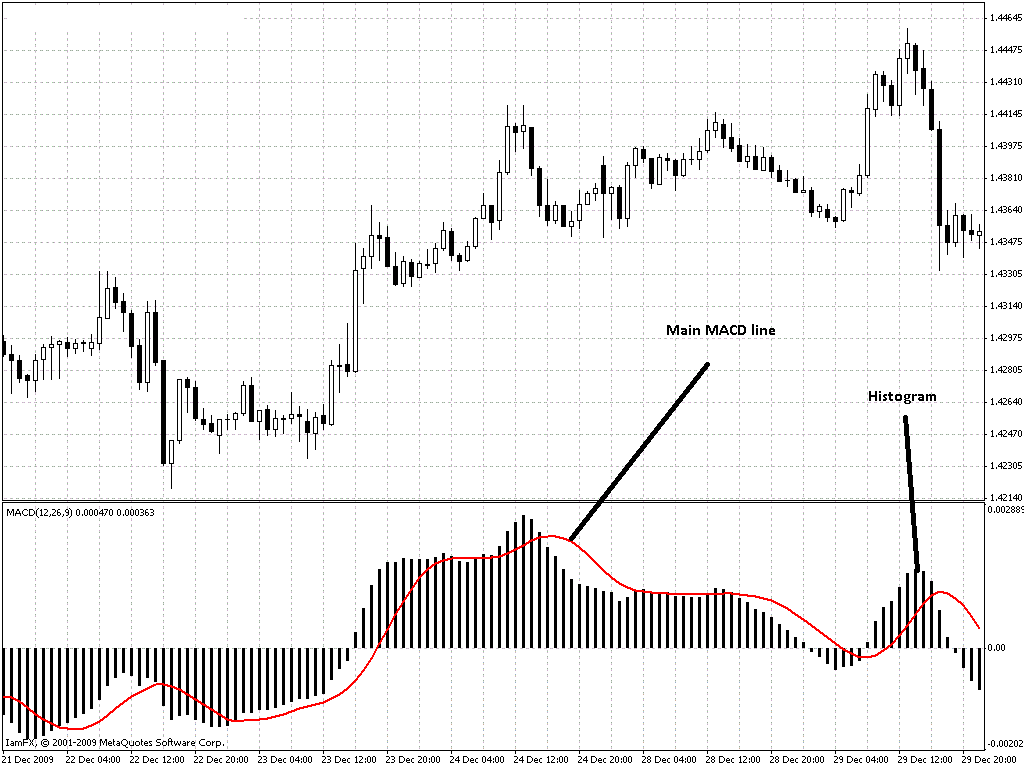
MACD main line = 26 period EMA – 12 period EMA
MACD signal line = 9 period EMA of the MACD main line
MACD histogram = main line – signal line
But what does this tell us ? I usually look at the MACD as an expansion of the moving average concept. As I told you on the first post on the indicator series – which discussed moving averages – the difference between two moving averages could be interpreted as a sort of “derivative” of averaged price action : A velocity. This is why I usually think of the MACD as the market’s speedometer. The MACD main line tells us about the velocity in which price is changing while the histogram tells us the difference between the main line and the signal line which is a measure of the changes in the main line or also a measure of the acceleration of price action (a sort of second derivative of price action). (on a small note, the MACD in mt4 does not display the signal line, only the main line and histogram, they might have considered the introduction of the signal line redundant as crosses between this line and the main line are signaled by the histogram crossing the zero line).
– –
–
Traditionally the MACD is traded in different ways with most of them corresponding to different changes in price action. For example, a cross of the main line through the zero line simply means that the difference between the 26 and 12 emas is zero, that is, the moving averages are crossing. If you trade these signals it would be nothing different than trading a traditional EMA cross. You can also trade crosses of the signal and main lines which would mean that there is a change in the “velocity” of price action. That is, price movement in that direction is “slowing down”. That would be the same thing as trading the cross of the histogram through the zero line, since the histogram signals the difference between this two lines. Now the best possible signals of the MACD would come from changes in acceleration, which would go before changes in velocity and would be the most early signals of the MACD. However the tops/bottoms of the MACD histogram are impossible to predict since usually several tops/bottoms can form before any meaningful change in velocity (a cross of the histogram through the zero line). An attempt to do this lies in trading the MACD histogram “divergence” signals with price, such trading is incredibly discretionary and not subject to automation.
Truth be told, the MACD, based on moving averages, has some of the same inherent disadvantages of these indicators with the advantage that the “speedometer” feature of the MACD allows for better entries into the market. However developing an automated trading system using a MACD is not that easy. Usually the problem is that the MACD fails under even only mildly volatile markets due to the sharp changes in velocity that the indicator lags behind. The MACD velocity signals (crosses of the histogram through the zero line) would probably be the best and easiest to implement in coding but a lot of effort must be put in using adaptive money management techniques and exits on MACD signals from a MACD with faster settings which may be able to get the system out of losing trades quickly. Definitely exits will be the most important aspect of a MACD based system. A combination of the MACD signals is also not out of the question. Do you have any ideas for an automated trading strategy using the MACD indicator taking into account all the above ? Make sure you share them with us on the comments :o).
If you would like to learn more about my work with automated trading systems and how you too can learn to develop your own systems with long term profitable results please consider buying my ebook on automated trading or subscribing to my weekly newsletter to receive updates and check the live and demo accounts I am running with several expert advisors. I hope you enjoyed the article !


Hi Daniel,
I enjoyed the article very much and I have an idea of a trading strategy based on MACD I would like to share with you and our readers. As its impossible to send an attachement with this comment, I´ll send the graph picture to you by email. I hope you find it interesting and the idea workable.
The project is an automated system based on MACD and Renko charts.
The renko was built based on a monthly chart. And it seems interesting to see that while monthly charts only gives us a down or up bar for the whole month, renko gives us up and down bars acording to the the trend and to the number of pips of each bar. And interesting is the fact that MACD 3 5 3 always gives us the exact moment when the trend is up or down and when it reverses.
May be i'm naive but it look an interesting setup to build an automated trading strategy. What do you thing? Of course I do not have any idea if it is even possible to code an EA based on renko charts. Is It?
King regards
Cador
Hi Cador,
Thank you for your comment and email ! I am glad you enjoyed the article. I received your picture on the MACD Renko chart system but you are missing several points which make such an approach unprofitable. Number one, you would always have to enter at least one bar later than your signaled entries because you would have to have a confirmed cross above/below the zero line to be able to avoid crosses that happen in an intra-bar manner. Second, this delay makes the system lose very large amounts of equity when the market whipsaws with few renko blocks between reversals. Long story short, renko charts are another tool and they are not miracle workers, the same shortcomings apply to indicators on all types of charts. Renko charts are particularly good at being visually deceptive, many times an indicator may appear "perfect" under Renko but the issues that I mention often account for most of this illusion of profitability. However it is possible to develop and trade long term profitable automated systems on renko charts. The system you mention may be indeed profitable with adequate money management (remember that MM includes BOTH lot sizing and exit mechanisms). Thanks again for visiting my website !
Best Regards,
Daniel