 –
–First of all, let us talk a little bit about how we generate renko/fixed range charts on metatrader 4. We usually use one minute charts of downloaded metaquotes data and then apply a script to generate the fixed range chart we want to see. We effectively generate a history file with all the information necessary to display these new charts. Now, some people have ventured into using this data to run backtests and their results have often been pretty fantastic, however they NEGLECT to take into account some VITAL aspects of this conversion that make backtesting and especially the backtesting of scalping systems ABSOLUTELY useless.
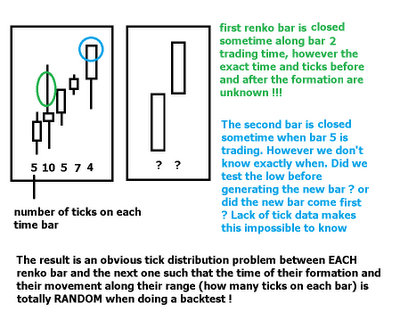
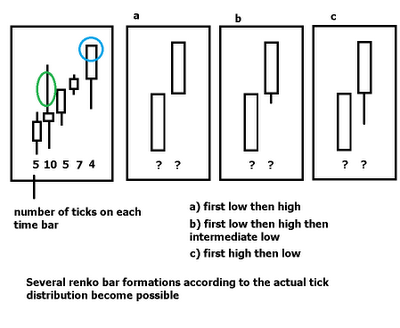
The main problem with the backtesting of system on fixed range charts using this generated data from metaquotes one minute information is that tick data is not available. Because of this we get into a problem regarding the splitting of the bars and the actual “volume” within each one of them since the formation of fixed range bars happens “in between” one minute candles. The result is that we don’t know when a new bar gets formed and the overall tick distribution becomes impossible to know. The image below shows you in a more graphical way what the problem exactly is. The end result is that a renko bar may have been formed before or after certain movements and therefore the whole movement of price and the exact formation of the fixed range bars is NOT accurate.
– –
–
This effectively leads to a massive increase of the errors generated by mass interpolation and it acquires a fairly important tone when using fixed range bars in the order of 1-10 pips. This problem of generation and tick distribution can be SO large that actual simulations are absolutely unreliable to the point where backtesting results may give extremely profitable results (a few hundred dollars to billions in a few years) of a system that in reality is a simple loser. Scalpers are extremely vulnerable to this since the actual formation of the bars is not known and therefore the actual “small movements” that determine their profitability and the timing of their signals is TOTALLY different.
– –
–
It is also worth understanding here that the problems with fixed range bars are FAR worse than those of a scalper within a time based chart since the actual distribution of ticks is actually known in time based charts and therefore the distribution of them between bars holds at least some similarity with reality while those of a renko chart are merely made up since no tick data to do an adequate “splitting” of the information is available. The shape of renko charts changes with one minute interpolation while this doesn’t happen with time charts. However backtesting of scalpers is unreliable in either case not only due to one minute interpolation problems – which may greatly overestimate profitability – but due to the lack of execution problems and spread information.
To sum it up, even though the generation of fixed range/renko charts is possible in metatrader 4 and 5, the actual use of these charts for automated trading is not possible since the actual usage of accurate simulations to get draw down and profit targets for these systems is not possible since no tick data to do an adequate tick distribution splitting is available. For this reason if you see any system that has a modeling quality of (n/a) and the owner says the backtest was done on fixed range/renko charts you already know why this system’s results are NOT reliable and why there is a GREAT chance that results are highly overestimating profitability and underestimating losses (to the point where real trading would show opposite results). Especially systems that use small renko bars and scalping techniques are bound to give astronomical results that are obviously not achieved in real trading.
Of course, renko bars are a great tool and it would be absolutely great to be able to do simulations with their data. However, until metaquotes decides to include tick data or we find a source of tick data that goes back to 2000 our chances of doing accurate simulations on this type of charts and therefore the development of systems with accurate profit and risk targets will not be possible.
If you would like to know more about automated trading and how you too can learn to code your own adaptive and likely long term profitable systems based on accurate simulations please consider buying my ebook on automated trading or joining Asirikuy to receive all ebook purchase benefits, weekly updates, check the live accounts I am running with several expert advisors and get in the road towards long term success in the forex market using automated trading systems. I hope you enjoyed the article !


Whilst some of what you say makes sense, you can perfectly well create an automated system from the renko bars. What you can’t do is assume that the renko bars are telling more than they are. If you have a system which only takes into account what renko tells, and more importantly what it doesn’t tell you such as what else has happened during the bar formation, you can have an effectively programmed system. For example if you have a bar of 10 pips, once a bar has formed and you entered a long position, you would have to have stop loss of 10 pips or over to make sure you have taken into account what could happen during the formation of the next bar. As renko is meant to help to show trends, scalping would be a pretty ridiculous task as you state.
What if you have TICK data on mt4 with 99% modeling quality? When you generate Renko from 1m charts based on tick data it would be still inaccurate?
Hi Okt,
Thank you for posting :o) Yes, it would still be inaccurate because when you test you would interpolate inside the renko bar (limitation of the MT4 tester due to the fact that renko bars do not have time information). If you want to test using renko bars you need to program the logic internally within the expert (to build the renko bars internally as trading progresses and evaluate the logic within this internal array) or build a tester program with proper renko support. I hope this helps,
Best regards,
Daniel
Daniel,
Do every people or strategies need such accurate backtests? I assume backtest will not be reliable if my strategy/indicators are based on the price action within a single Renko brick, but if I’m using only completed Renko candles is there any difference?
Hi Okt,
Thank you for your posts :o) I can tell you that it does make a big differences and you simply cannot get accurate Renko candle back-testing with MT4 due to the platform’s limitations. I encourage you to do a test of a renko back-test using renko charts and a program with adequate accurate renko back-testing , you’ll see that MT4 tests on renko bars are a complete waste of time (even if you only use the full renko bars, the problem in its essence has to deal with actual renko construction and the absence of adequate time stamps when using renko hst files). Anyway, don’t take my work for it, do your own tests and you’ll see it for yourself :o) I hope this helps,
Best Regards,
Daniel
It is possible to backtest 99% accurate with renko bars. We have been doing it for a while.
We take the Dukascopy tick data and generate “backtesting” renko bars that do not interpolate. It is the same principle of making 1m bars with tick data.
In other words, when we run any EA with these hst, price action moves tick by tick in between, before and after a renko bar is printed, replicating exactly as if we were running the EA in real time with a live feed.
The generated “backtest” renko is different then a normal renko printed
in in real time.
We use a commercial renko EA. The developer worked with Birt scripts
to make it possible. I am not sure will work with the free renko available everywhere.
Most our our work is renko based and for us was crucial to get good quality BT. The commercial renko is very inexpensive ( I think we paid $35 about a year ago). Well worth the money. Allows to generate these BT bars and also has a nice “offset” feature allows to change bar configuration for real time.. like using 10 pips renko but wanting that all bars print, say with price ending at 13, 23, 33 etc.
I think would be wise you include this info in your eBook. A lot of people know this and probably all would find out soon or later and that would not look so good for the material you sell.
J.
.
Hi jeuro
I am also using Renko Charts and would like to backtest at 99%.
I am getting 0 mismatches but only at 25%.
I also paid for the Renko Charts and would really appreciate it if you could provide any help with getting my back testing up to 99%.
Best regards
Mike
Yes, I found serious problem on my renko chart,
My renko chart (not a free version) can perfectly draw HLOC and continue from Close to next Open. There is no jump on price action drawing in case of Close to next Open Bar. This is perfect, while all free version is jumping while about to draw Close to Open reversal.
But the main problem for me is Intra Bar on backtest, its tick by tick movements before shaping 1 complete bar are not represent real market, unfortunately my strategies is Intra bar trading.
For bulish bar, backtest tend to shape the renko bar as Open->Low->Open->Close, while for bearish bar renko tend to shape the bar by Open->High->Open->Close. Markets tick by tick movement are not that simple. I cant find any solutions for this except test my strategies stright on demo account test.
Its not about how many ticks on historical data, but its about replicating scenario of tick by tick movement.
I guess someone has suggestions or solutions for this.
Jeuro,
would you mind sharing a link to that commercial EA.
We use a commercial renko EA. The developer worked with Birt scripts
to make it possible. I am not sure will work with the free renko available everywhere.
thnx Ron
JForex platform (Dukascopy) java strategies & historical (tick data) back-testing are the answer !!
MQL is far too limited for this type of strategy.
Any update on the EA that we can get accurate Renko with?