Awesome Oscillator = SMA(MEDIAN PRICE, 5)-SMA(MEDIAN PRICE, 34)
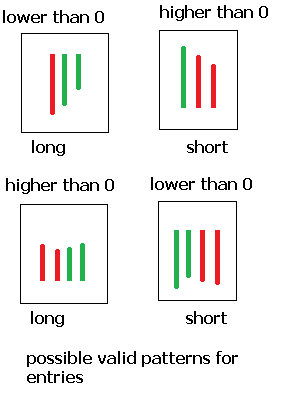
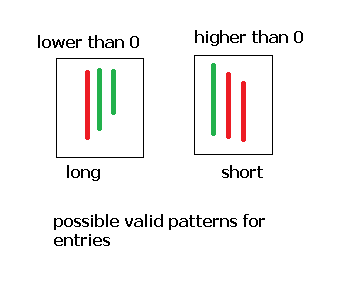
You might have also noted that the awesome oscillator contains red and green colors which depend on the increasing or decreasing nature of the values. If the last value is lower than the current values the current bar is green while the opposite case makes the bar red. To sum it up the awesome oscillator tells us if the 34 and 5 period average values of median price are coming closer or falling further apart. When the values are falling apart there is momentum (since short term price is – in average – moving away from the longer term average, when the values are closer then we have the opposite.
– –
–
It may now seem more evident how this indicator might be traded. We can build a system that trades the cross of the 0 line (which is equivalent to the simple moving average cross system of the 34 and 5 period MA values calculated on median price) or we can trade changes in direction (changes from red to green) to attempt to capture changes in momentum which may forecast an eventual cross of the moving averages. However the fact that the oscillator only gives us information about the momentum change taking into account a relatively small number of bars means that its success on lower time frames is bound to be very limited. When using this indicator on time frames lower than the daily you will see that it gives extremely confusing signals since the 34 and 5 median calculated moving averages cross a lot, something that makes the finding of an inefficiency quite hard.
Added to that is the fact that the awesome oscillator momentum “changes” (color changes from red to green) can happen during a single bar and therefore give a lot of fake signals. For this reason most people will advice to trade this indicator on three bar signals to gain a better perspective and eliminate signals that are simply spikes that might only “seem” like changes in momentum. By doing this we can gauge changes in momentum better and build a system that reacts quicker to changes in market direction. Exiting trades when the first opposite bar appears also seems to be a good exit strategy since usually this won’t happen after the majority of the large move happens. Of course, the success of such an approach is bound to be minimal on lower time frames, again due to the inherent problems of the low period usage of the awesome oscillator on these charts.
– –
–
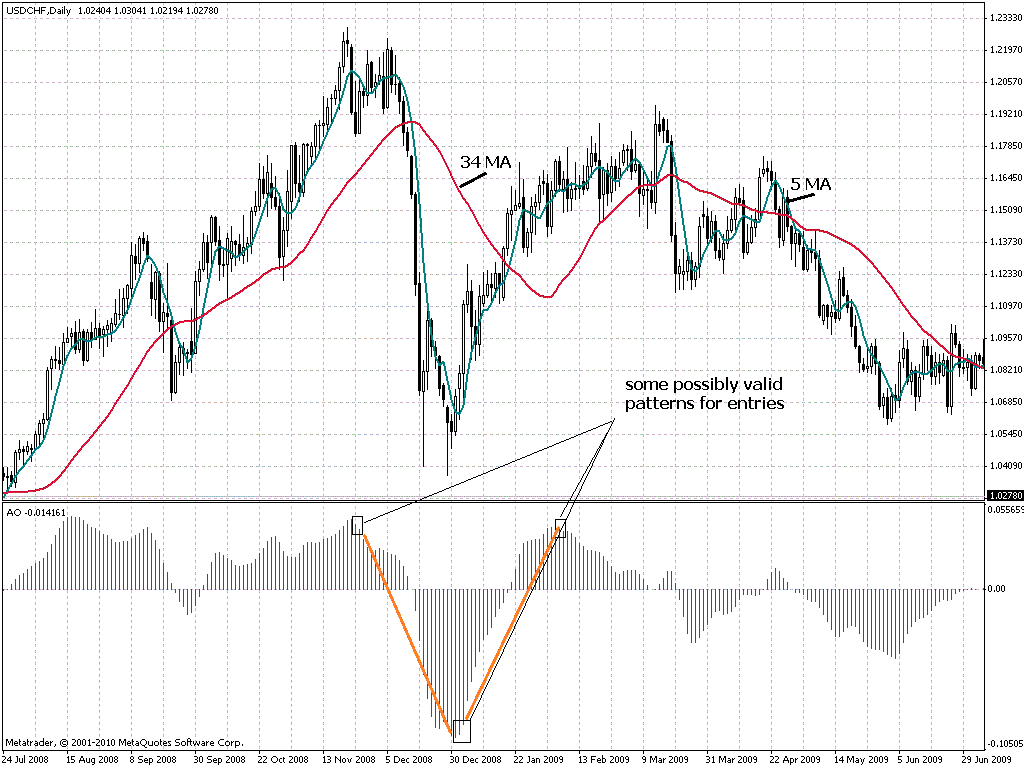
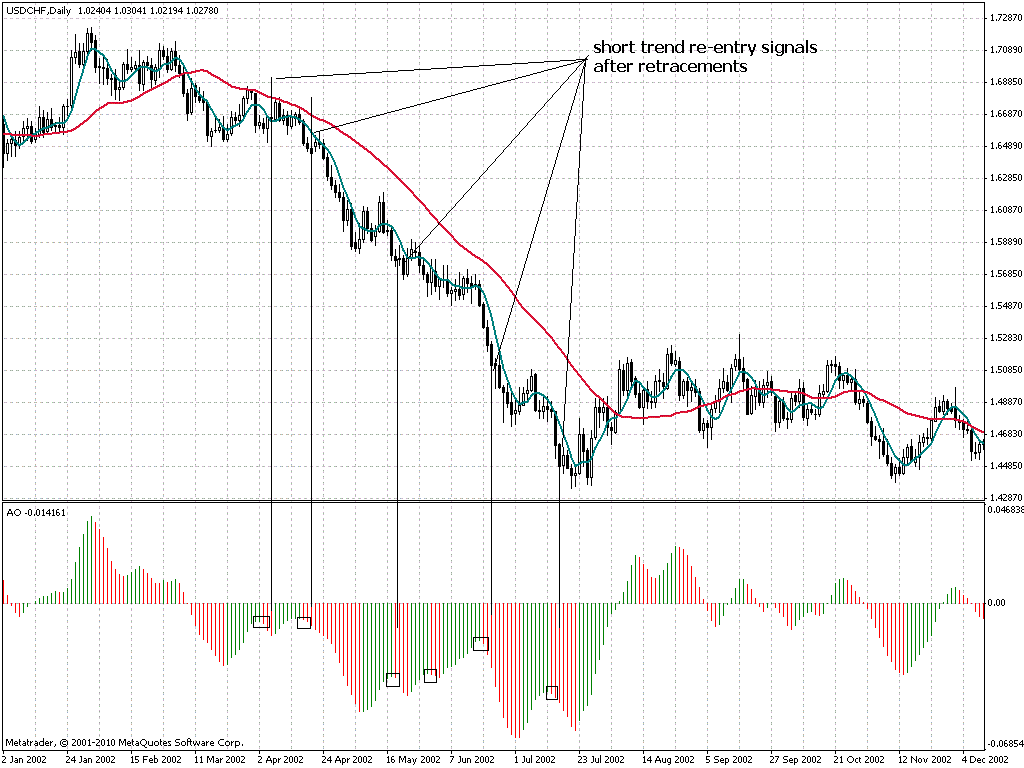
Above you can see a USD/CHF daily chart with some of the possible signals during the financial crisis which was a very trending period for this and other currency pairs. You can see here how the awesome oscillator would have captured moves with very good accuracy. Of course, the system is not going to be perfect and under conditions when the 34 and 5 MA comes close for large periods of time the system would suffer large amounts of losses (this is the system’s market exposure so that it can get into this very good trades when they develop). The above mentioned signals also allow us to get back into trends after retracements, so they are definitely a necessary compliment since they help us fully exploit large runs without missing a large part (as if we only entered shorts above 0 and longs below 0).
– –
–
So as you see, the awesome oscillator is really not that awesome, it is simply a tool to measure momentum which compares the prices of two simple moving averages calculated on median price values. This information is bound to be useful for the development of a momentum based automated trading system, especially on large time frames – like the daily – where these signals are much more meaningful than on lower time frames when the low periods used by the oscillator will make the finding of inefficiencies extremely hard, if not actually impossible.
If you would like to learn more about automated trading and gain a true education in the development of likely long term profitable mechanical trading systems please consider joining Asirikuy.com, a website filled with educational videos, trading systems, development and a sound, honest and transparent approach to automated trading in general . I hope you enjoyed this article ! :o)


Hey Daniel.
Thanks for the post. It is good to have "indicators revealed" from your blog. That way, being I read most of your posts, I don't have to go searching for what an indicator does. Your post today reminded me of how I have been contemplating using indicators on the daily chart to help me when my EA trades on the hourly. Example, if the awesome oscillator is showing momentum on the daily in a short term movement. Then any trades I take on the hourly based on my entry points for my EA, short trades may likely be what I should take and I could weed out taking any long trades, or minimize risk in some way. I am guessing you already have considered this concept and probably do stuff in similar.
On another note I may need some explanation on your God's Gift ATR EA. I did a back test but feel I must be missing something. Maybe I forgot to include one of your indicators to MT4, maybe I missed reading it somewhere. My results are not what I would expect. 17% over 2000-2009 using Risk=1 and the other risk setting =26. Would I get an error if I was missing a indicator? Do I have a setting incorrect? At any rate, if you wish, time permitting, you can drop me a message on my blog, or email townjet@gmail. I would be greatly appreciative.
Thanks for your posts.
JT
Hello JT,
Thank you very much for your comment :o) I am glad you like the indicator series of posts and that you find the contents useful. Definitely I have considered from time to time the use of higher time frames to improve trading systems but most of the time I have found this effect to be detrimental instead of positive. Often it is the simplest techniques that tackle the most fundamental aspects of the market that succeed.
Regarding the EA, depending on your settings that Risk = 1 result might be normal, just increase the risk to increase the profit (of course draw down will also increase). Do NOT focus on the absolute profits but focus on the average compounded yearly profit to maximum draw down ratio. If that ratio is good (higher than 1:1) and you want more profit you can simply increase the risk until you match your profit/draw down appetite. Regarding the settings you can email me (ekans_(at)hotmail.com) with them so that I can take a look and tell you if they are or not correct. Remember that the EA needs the Keltner Channels, Keltner Channels B and Waddah Attar Explosion indicators.
Thank you very much again for your comment and for being such a faithful reader :o)
Best Regards,
Daniel
Thanks Daniel,
The only things I changed in the settings are, true for 5 digit broker and I changed the Risk=2 to see the effects of it. I may be missing one of the Keltner channels, maybe both. When I get some time I will double check and try again. 17% over 10 years with Risk=1 seemed a little low based on results I've seen on the older version, 7c, Chris has been demoing on his blog.
I will give it some more time… When I get some more time. :)
Thanks
JT
Hello JT,
Thank you for your comment :o) The thing is that the risk calculation for both experts are really different so you will have to change the risk to match that of 7c if you want to compare results. When you do calculations that get the same maximum draw down level as that of Chris's results you get better overall characteristics with the God's Gift ATR on the settings proposed on the ebook.
If you want you can join Asirikuy where there are several accounts currently testing this EA (almost 18 months of live results), I believe that if you intend to run this EA live Asirikuy might provide some very important information. Thank you very much again for your comment JT,
Best Regards,
Daniel