You start your trading day and your screen is filled with indicators and clutter. The obviously beautiful layouts, tons of trend lines, support and resistance levels and indicators are nice to look at but interpreting what they say is difficult. You have a 20 period RSI giving a signal that you would normally take but you do not do so because you have a 100 MA that contradicts what it has to say as well as a Parabolic Sar indicator and a candlestick pattern formation you don’t like at all. Even though the setup is pretty good you do not take it because you are paralyzed by the amount of technical data you are having to analyze. You have been officially paralyzed by your own analysis.
This “paralysis by analysis” is far more common that what people usually think it is. It happens especially to traders who have been into trading between 6 months and one year which is the period in which people become a little bit obsessed with perfecting their entry techniques (from what I have seen at least). Paralysis by analysis is not good as it is usually a symptom of lack of confidence and the need to have what people believe are “high probability setups” by putting up as many signals as possible together. Traders who get paralyzed usually believe that they need to see “agreement” between many different indicators and that this – in itself – will provide them with the statistical edge they need.
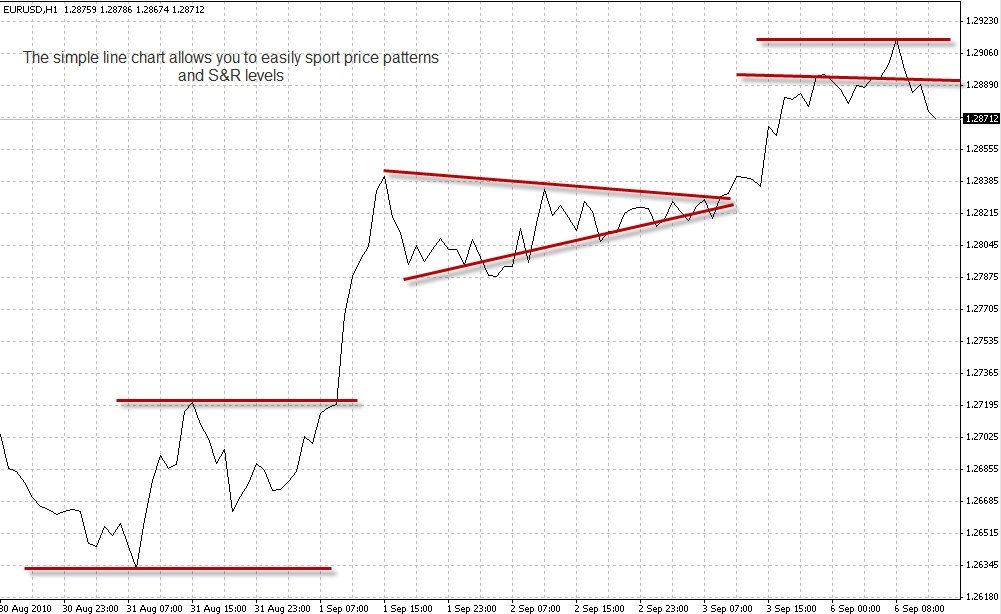
If you feel you are in this situation, then you need to make a change. When I got paralyzed by my analysis I found out that the absolutely best solution was to go back to the simplest form of a trading chart, the simple line chart. This is a setup that shows you price action merely as a line moving on your screen, it is fantastically easy to interpret and it shows support and resistance levels with a clarity that is not rivaled by any other type of chart (perhaps only by renko charts). The simple line chart easily allows you to determine where price is headed and to draw support and resistance levels without breaking a sweat. Below you can see an example of this.
– –
–
The main advantage of the simple line chart over other types of charts used in trading is that it is extremely simple. Even though price action may seem difficult to follow and price patterns hard to spot and interpret on a candlestick or similar chart, on a simple line chart such things as price patterns and price direction simply jump off the screen. Traders usually do not resort to a line chart because they consider them exceedingly simple and “lacking” in the amount of information they give them regarding price action movements but the truth is that line charts offer you one of the clearest pictures of overall market action and – most importantly to new traders – it is the most intuitive chart to interpret.
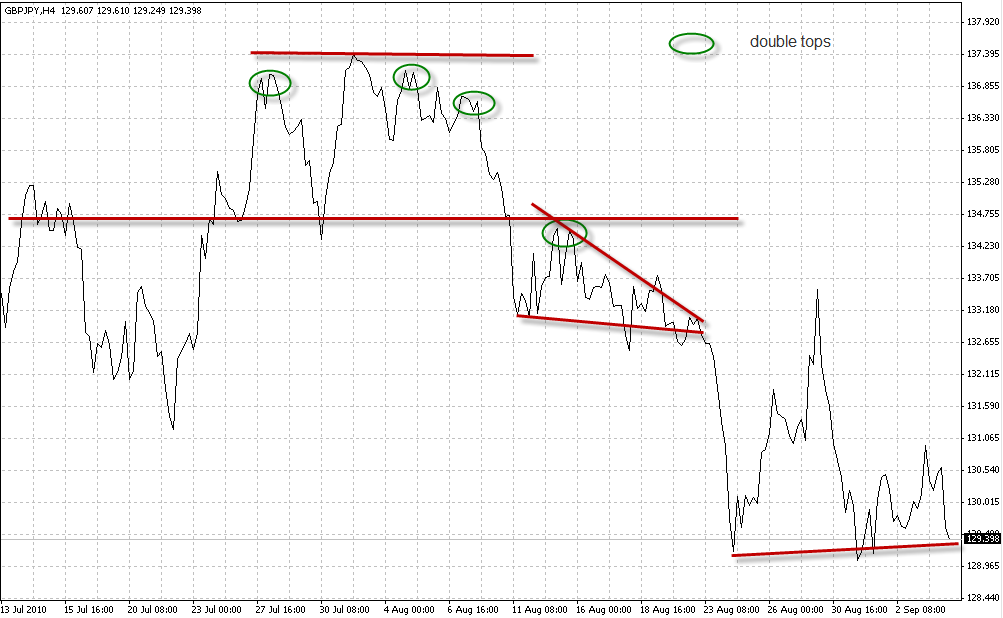
While spotting trends and support and resistance levels on a candlestick chart can be harder, doing so in a line chart is totally easy as these things are evident most of the time. For this reason I have found that for traders suffering from paralysis by analysis, the line chart provides an extremely valuable tool to get rid of all the analysis tools and come back to what actually matters in trading, price action.
– –
–
So even though simple line charts are no miracle tool and they won’t make you a profitable trader on their own they will provide you with a very clear, simple and effective analysis tool that will greatly help you improve your trading and remove any paralysis you might actually have that could be eliminating your ability to trade in a reliable and long term effective manner.
If you however would like to learn more about my work in automated trading systems and gain a true education in their use and design please consider joining Asirikuy.com, a website filled with educational videos, trading systems, development and a sound, honest and transparent approach automated trading in general . I hope you enjoyed this article ! :o)


