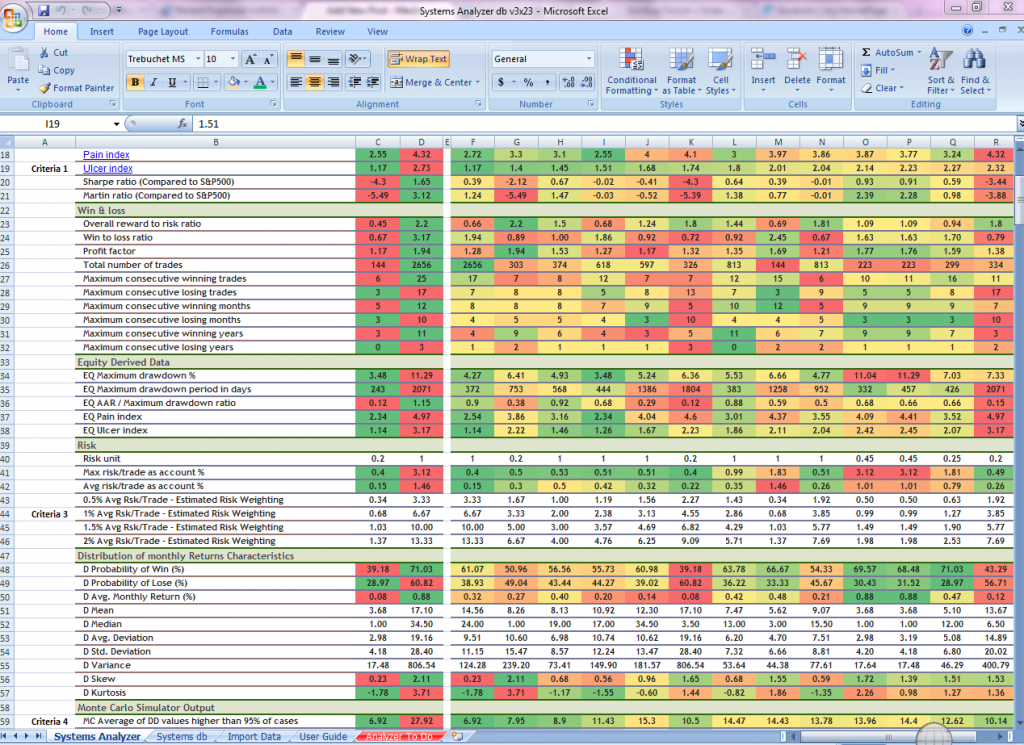
Right now in Asirikuy we have well over 100 different backtests covering our systems on all the different currency pairs and parameter sets in which they trade. Analyzing and comparing these backtests is a complicated task since you have an amount of information which simply increases as the number of systems grows bigger. Right now the way in which we have been comparing backtests has been purely manual since we lacked any tools that allowed a direct comparison of the different statistical characteristics of the strategies. However this will change soon as two Asirikuy members have developed an excel analysis tool that enables the simultaneous analysis of all of our systems, giving us the power to order/filter them according to some specific characteristics.
Definitely one of the most important tasks you need to carry out when creating portfolios is system comparison. When you are attempting to group systems with coherence it becomes obvious that knowing their statistical characteristics becomes important. This is not only important because comparison allows the “cherry-picking” of the best possible portfolios but because it also allows for the building of portfolios according to criteria which are not derived specifically from performance (seen as profit). For example one could build a portfolio from systems that have low Ulcer or Pain Index values – to lower psychological pressure when running it – or a portfolio based on Monte Carlo Annualized average profit to worst case ratios to build a portfolio from the most robust strategies. Other criteria such as the grouping of systems according to risk to reward or winning percentages are also possible.
–
What is relevant to know here is that system comparison is a very useful tool which allows us to see what the main characteristics of a system are. It allows us to group systems into different categories and to use either mixes of these categories or their pure components to build trading strategy portfolios. When you can compare systems objectively you have a much better chance at building a portfolio that not only has higher chances of success but that fits your trading personality best. Many people wouldn’t be able to trade an Ayotl, Quimichi or Comitl portfolio due to the characteristics of this type of strategies while other people would trade nothing but systems with this level of robustness.
The tool created by two Asirikuy members uses Microsoft’s Excel to save all the statistical characteristics of the systems within a database for easy-to-do comparisons. The workbook has some coded macros which allow you to run a comparison that searches the database and provides and ordered and colored list according to the criteria you have demanded. This is extremely useful as you’re able to sort Asirikuy systems in a way which is more natural to your goals in portfolio building. You can then easily create a portfolio that best matches your desire for a specific system characteristic being this performance or non-performance related.
The great thing about this tool is its ability to make comparisons a “walk in the park”. The tool – currently still under construction – allows you to get an in-depth view about Asirikuy systems. The color coding done automatically provides an overall “bird’s view” of which characteristics favor each system and how a system that ranks high in one characteristic compares to others that also rank high in this criteria. For example an analysis searching for systems with the highest risk to reward ratio quickly reveals that Ayotl instances have the highest ranks in this regard, not surprising due to the fact that the turtle system uses a long term trend following technique enhances by pyramiding. It becomes obvious that high risk to reward is accompanied by reduced risk percentages and some better Monter Carlo characteristics.
Overall this tool fills a large “void” we had in Asirikuy pertaining system comparison, we were lacking a way to be able to put systems face-to-face; a way in which comparisons could be drawn in order to reach a better understanding about the ever-growing world of Asirikuy trading systems. This tool will probably be finished soon and I will be making videos about it in order to release it to the Asirikuy community. If you would like to learn more about my work in automated trading and how you to can learn and truly educate yourself in the field of automated trading please consider joining Asirikuy.com, a website filled with educational videos, trading systems, development and a sound, honest and transparent approach towards automated trading in general . I hope you enjoyed this article ! :o)


