You could say that one of my “obsessions” through the past few years has been the understanding and description of support and resistance (S&R) from an entirely algorithmic perspective. Although I have not focused very strongly on this subject, it’s a topic I visit from time to time with the hope of applying new ideas and getting new insight into what traders describe as S&R. Through the past few months – thanks to my collaboration with Fd – I have revisited the topic again and gained new insight into how we might get a good algorithmic description of S&R with a true statistical edge in predicting price bounces and breakouts. Today I am going to talk a little bit about some of the new definitions of S&R I have applied and how time plays a fundamental role in determining the real importance of S&R levels. Although the specifics will probably be relegated to future CT articles with Fd, today you will gain a good idea of where things might be headed.
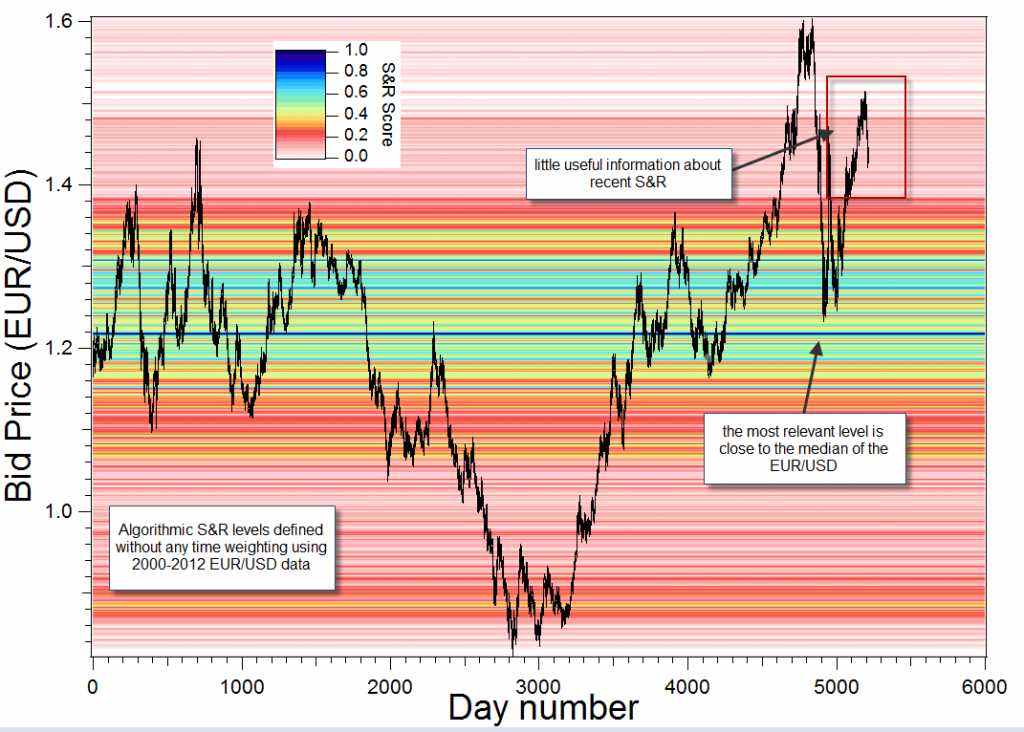
First of all it is interesting to say that all my attempts to describe S&R have been haunted by a problem dealing with the lookback period used to determine the S&R level relevance. When you are trying to define S&R zones through any methodology, it soon becomes clear that you need to define some sort of period in the past where you are interested in finding S&R levels. If you choose the period too long – as in the image below which shows a 11 year period used to draw S&R levels – you will find that what you get isn’t what any skilled trader would put on the chart as S&R. The problem is that when you try to score S&R levels you will instantly get more hits in zones that have been more congested in the past (naturally because these are consolidation periods) but these zones might be far away from the currently developing action. Knowing the most congested levels during the past 11 years has hardly any relevance.
–
–
When we want to find levels that are more relevant to current trading we then find that we need to look into some period in the recent past that is long enough to give us a good idea about the relevance of the levels but short enough as not to catch any other congested zones of the instrument’s history. When you do this you find a good description of current S&R levels and consolidation zones but you end up with a problem dealing with projection targets. When traders look manually into S&R they often use recent levels to draw breakout zones (limits of current consolidations) and older levels to define possible targets. The problem is that if we look too deep into the past (to see potential targets) we erase the relevance of the current consolidation zone edges and if we look only into the recent past we do not get any targets because these levels have not been tested recently.
It is a dilemma that encompasses the power of the human brain in quickly catching the relative relevance of S&R levels by looking at charts of different scales. Although the jury is still out on whether this methodology has an edge – future research will shine more light into this – it is clear that defining an algorithmic S&R methodology that shows levels on the screen as I would interpret as a manual trader is terribly hard. The problem is not mainly in the definition methodology – which can involve fractals, high/low patterns, etc – but in the relative relevance of S&R levels as a function of time. Solving this problem is fundamental to the design of an S&R methodology that is able to draw levels that enable both the accurate picturing of current consolidation edge relevance and the possible targets that breakouts might reach.
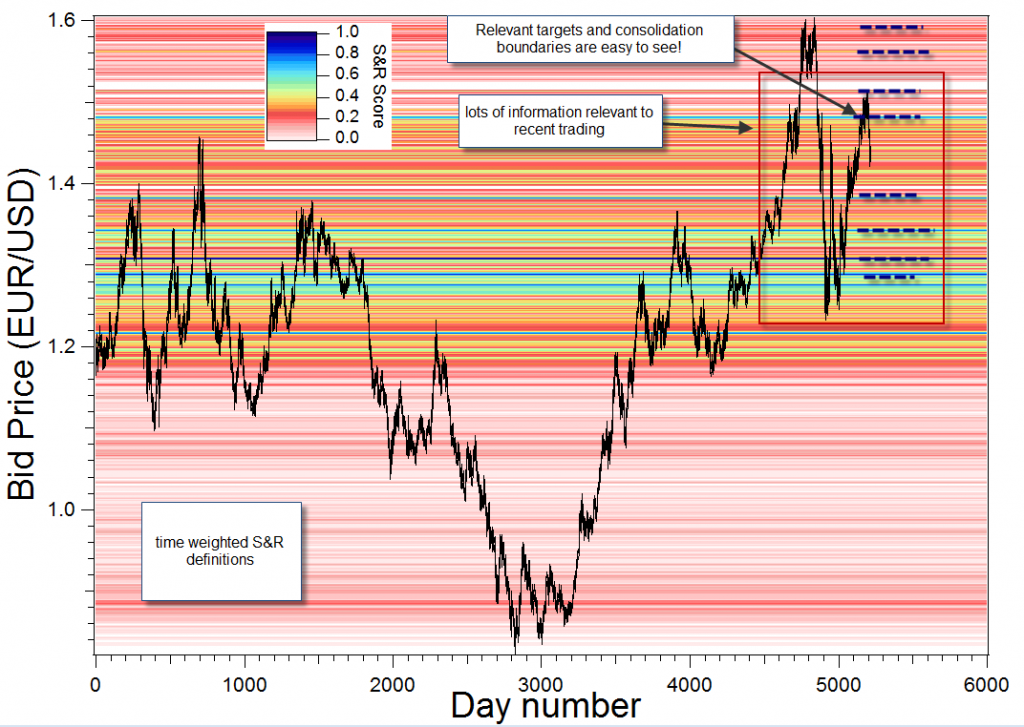
The answer I am exploring is actually very simple and is able to solve this problem in a computationally efficient manner. What I am doing is determining the S&R relevance of levels using all the available history but I am weighting the S&R level score in a manner that reflects the age of each test of this S&R level. Zones that have been tested in the recent past get more relevance than zones that have been tested a long time ago. Since relevance increases exponentially with time, I get a good idea of what has been most relevant in the very recent past. However, since levels tested in the past still get to contribute in a small manner I also see possible targets that would be reached from breakouts of the current S&R levels.The exponential weight coefficients can then be adjusted to see the S&R relevance on different time frames, according to what I want to achieve. For example if I want to see current consolidation zones for the past year and targets that may be reached within the next decade I use a smaller exponential weight coefficient while if I want to see monthly consolidation zones with yearly targets I use a heavier coefficient.
–
–
By using this exponentially weighted S&R definition methodologies I am then able to see levels as I would as a manual trader, enabling me to actually test my skills as a long term manual trader on algorithmically defined S&R levels. However I still don’t know if this technique does predict levels/zones that are statistically relevant and I am yet to test whether this methodology can be used to create systems with a statistical edge. However at least I now have a definition of S&R that matches closely what I wanted and hopefully the algorithmic implementation will also allow me to see if my view as a manual trader is correct. The field of manual S&R definitions and trading is a challenging one and will definitely lead to a much deeper understanding about any inherent edge – or absence of one – using S&R methodologies.
If you would like to learn more about algorithmic trading and how you too can deepen your knowledge about this please consider joining Asirikuy.com, a website filled with educational videos, trading systems, development and a sound, honest and transparent approach towards automated trading in general . I hope you enjoyed this article ! :o)subject


Hi Daniel,
Thanks very much for another really interesting article. I agree with you – this time weighted attribution of relevance to S&R levels is much more intuitive and the chart looks more like what a manual trader might draw.
Please let us know your findings when you make a system based on trading these levels.
Mun