Since the creation of the Qallaryi strategy at Asirikuy there have been significant problems with the congruence between its back-testing and live trading results. Since the strategy had implemented an hourly time filter that allowed the trading or not trading during each specific hour of the day, our first thought was to think that this lack of coherence between live and back-testing results – in the sense that live trading always proved to exceed expected losses – was associated with some problem related to the time filtering. In essence we were thinking that the large number of degrees of freedom associated with the strategy caused an excessive curve fitting of the system to the underlying data, wrecking havoc in live trading. However – after truly discovering and correcting the reason behind this – I can now say that Qallaryi can be as robust as any other system and, moreover, it can have even better results than most strategies.
Qallaryi’s first trading appearance was in 2011, the strategy was evaluated through back-testing and passed through the regular filters (at the time) at Asirikuy. Since results looked good, I decided to trade it live on three different live accounts in order to evaluate the potential of the system and verify live Vs back-testing coherence to check that the strategy was trading properly. After several months of back-testing results showed an immediate dive into drawdown that took the strategies towards its Monte Carlo worst case scenario about 6 months later. Back-testing and live testing results were not very consistent with even strong variations between results amongst different brokers. A strategy that seemed to be good turned out to fail almost immediately, something we had never seen at Asirikuy.
–
–
So what was the problem and what could we learn from it? Initially we discovered several issues that seemed to point towards what was wrong, a problem with the timing code when back-testing explained a significant part of the variations we had observed but this still left a big part of the story unexplained. Due to this fact we started to think that the problem with Qallaryi was trade chain dependency, so we believed that problems would be fixed once we moved to the F4 framework. Upon the first releases of the new trading framework and the retesting of the strategy everything seemed to be going fine until we started running tests with a new feed (forex-historical data) and found out that there was a big difference in results between the Forex-historical and Alpari UK data sets. The problem was still there…
At this time I almost gave up on Qallaryi. After several modifications of the code to try to make the measuring of moving averages less dependent on outliers (using medians instead of averages for example) I found out that – no matter what I did – the results of Qallaryi were highly feed dependent and they also never seemed to work on out of sample tests. It seemed that the very flaw of this strategy was the use of the time filtering code, if the idea of filtering certain hour block generated big dependencies on the feed, then this idea couldn’t be applied to live trading. Then we had an epiphany – thanks to Morgan – about the differences between the feeds and how this affected our strategies.
–
–
The two feeds we are using are GMT +1/2 (Alpari UK data which has an offset different to the Alpari live servers) and GMT 0/0 (forex-historical), they both open for the week at Monday 00:00 and they both close during Friday at 22 or 23. The interesting part here comes when you consider that the Monday 00:00 hour for Alpari UK is actually hour 22 on Sunday for forex-historical (which the data doesn’t have). This means that Alpari UK has 2 more hours in the beginning of the week and – in an analogous fashion – the forex-historical data has 3 more hours at the end of the week (because it closes at 23 instead of 22 and it’s back 2 hours against Alpari UK). So in reality the problem here is that both data sets do not contain the same amount of information. One set contains additional candles in the beginning of the week, the other additional candles in the end.
When you consider a moving average strategy such as Qallaryi, it soon becomes evident that a couple of completely different bars during the week can cause a very large difference. Moving averages are particularly sensitive to outliers so big candles at Friday GMT 22-23 caused significant problems with the hours in which crosses between averages happened. In essence what we have here is that the difference in information causes a large distortion in the averages that generates the big problem in matching between feeds. This also seems to be the cause of variation when trading live because different brokers with different GMT offsets but the same weekly starting/ending times can have significant differences in information. So, the hypothesis evolved to a problem reliant on information and not on time filtering.
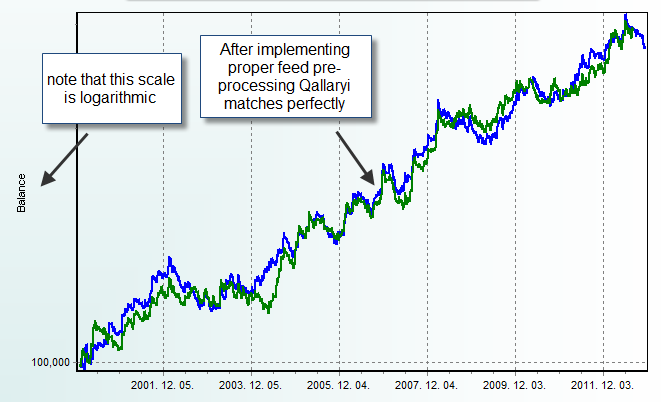
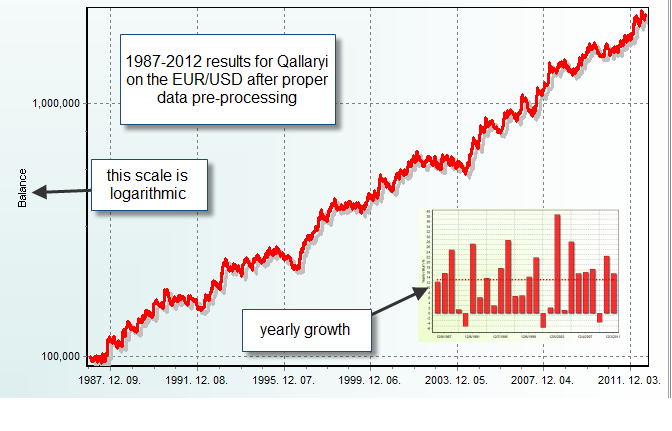
In order to test if this was the case I modified the F4 framework in order to filter hours below Monday GMT 4 and above Friday GMT 19 in order to have two feeds that contained exactly the same information. This means that all candles for the week – after time corrections – represent the exact same times for both brokers. This eliminates any mismatch in information and simply leaves us with the regular candle variations that are a normal characteristic of the Forex market. The results showed that Qallaryi now behaves like an amazingly coherent strategy, with results in back-testing that match to a very large extent on both feeds. Additionally most of the parameter sets derived through rank analysis on the 2000-2009 Alpari UK data turned out to be stable and profitable on the forex-historical data on a test from 1987-2012. This means that not only is the strategy coherent between two feeds, it is still profitable when evaluated across more than 15 years of out of sample testing (not used in the optimization). A 25 year simulation obtained on a secondary feed – with coherence with the optimization feed – with more than 15 years of out of sample data suggests the strategy is robust. Moreover, this exercise was repeated across several pairs with equally nice results.
–
–
This past week-end I released a video at Asirikuy explaining – in a clearer way – the above differences between feeds as well as how they can be corrected and what can be achieved when these corrections are made. The present advances and corrections are going to be included on the next release of the F4 framework and will open up the way to a much higher robustness for Asirikuy strategies. When using a system on multiple brokers – or a broker where the live feed time stamp is different from the back-testing data in anyway – correction of information problems and the attenuation of data variations is definitely a must. This convincingly shows that time filtering does NOT reduce robustness, improper pre-processing of back-testing data does.
If you would like to learn more about robustness and how you too can learn how to improve your own strategies please consider joining Asirikuy.com, a website filled with educational videos, trading systems, development and a sound, honest and transparent approach towards automated trading in general . I hope you enjoyed this article ! :o)


All I can say is wow amazing guys, can’t believe such a small issue caused such large problems. Really glad this was sorted out thanks a lot Daniel and Morgan.
Apologies for my lack of participation the past two months, I started my first job and things are hectic here. As soon as I’m a bit more settled I will jump in and help again.