A few weeks ago I talked about the idea of using images in order to build a neural network engine to predict price movements on the Forex market. This idea – which had already been tried in an article I showed – has the potential to make an NN view the market as humans do, using graphics with intrinsic geometrical correlations as the input to make predictions on different currency pairs. After sometime implementing this concept, I am now happy to say that I have fully implemented this analysis methodology using the Asirikuy F4 framework, opening up the way to a ton of new tests and systems using images as their base. Certainly this was far easier than what I anticipated, thanks to third party libraries in C++ and the nature of the F4 framework which makes their implementation and usage a complete breeze. Through this post I will discuss how I implemented this, how it can be improved and the possibilities it might open for us within the Asirikuy community.
The task at hand didn’t seem simple at all. We must take data, generate potentially thousands of images with just the right amount of information and then get pixel information from the image data in order to pass this to a neural network. To do this we must find out how to generate financial charts at custom sizes (because the size of the image determines the topology of the neural network), how to process these images to get the pixel data and finally to properly structure this process so that we can train our neural network with a series of past images and then get a prediction from the latest market chart. All of this would have been extremely harder if I had been unable to use third party libraries, however – thanks to the F4 framework – I was able to leverage on developments made by other people.

–
But how did I exactly achieve this? The first step was to find a way to create financial charts in custom sizes with whichever characteristics I desired. It wasn’t easy to find a library that could do this since many charting libraries lack the proper candlestick or OHLC data types needed to make financial charts and, moreover, the implementation of these libraries isn’t easy because they are either very complicated to compile (lots of dependencies) or they aren’t simple to use at all. Another problem is that many of these charting packages are too expensive – the commercial ones – and the open source ones didn’t fit the profile due to the above mentioned issues. Funza Finally I was able to find ChartDirector, a very easy to use package in C++ that allows me to save “png” image files of any OHLC chart at a custom size and with any colors I desire. Although Chartdirector is a commercial package, I deemed it worth buying since it also allows us to create OHLC charts and indicator charts for other trading systems – not only this NN implementation – allowing us to create images within the F4 framework (which will make debugging and system design much easier). With this package we will now be able to do things such as getting internal screenshots of trades or simply an internal glimpse at how the refactored historical data looks like inside F4.
After figuring out the image creation problem, the next step was to figure out how to process this images to get access to the pixel data. There were several options available (including LibPNG) but the simplest solution I found – the easiest to implement – came in the form of the DevIL library which is an open source project that implements many of the open source image processing libraries (like libPNG, libJPEG, etc) into a simple package with a very easy to use functional front-end. This library was very easy to add to the F4 framework, giving me access to a tremendously large set of tools for image processing. Using this tool I was able to read the image files created with chartDirector in order to get access to the pixel data. With this information now accessible it was only a matter of getting these inputs into a neural network to start making predictions.
–
–
The NN implementation was not that complicated as I am already used to programming using the FANN library. I created a neural network with 2500 input neurons in order to handle a 50×50 pixel image – which is very small – as a first test of this functionality, plus a hidden layer with a smaller number of neurons. ChartDirector was able to generate these 50×50 images without any problem, compressing the candles so that the largest amount of information remained on the chart (it was rather surprising that Chartdirector could do this automatically). As for the inputs and outputs, my idea was to use the past 24 hourly candles as inputs and then attempt to predict the next day’s data, something pretty straightforward.
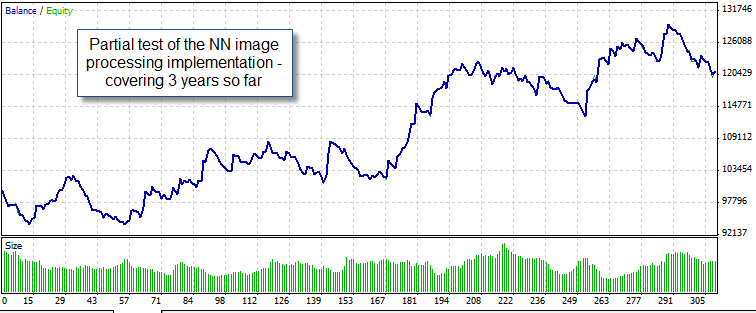
Finally the program was created and the testing could begin :o). The program was finally designed to train on every daily candle, using N examples from the past. On each training the images are dynamically generated (only one image is handled at a time) and the pixel data is read directly after this using DevIL. Since only one image remains in memory at a time the implementation is very efficient and is able to go through back-testing at a decent phase (about 0.5 years per hour). The end result is a dynamic system – retraining on every candle – that sees the market in a similar way as we do, taking into account graphical information in order to make trading decisions. The neural network has no idea what OHLC is or what the values are, it only has an image with a certain geometrical pattern that it uses to train itself to predict certain outcomes (just like we often do!).
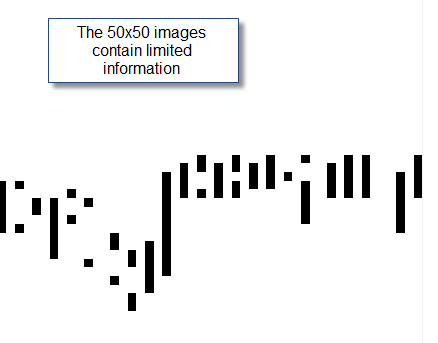
I have to say that I was very eager to post this after finalizing the implementation, so my first back-test is still running. So far the system has been able to achieve decent results – at least profitable ones – but it will take a while and many repetitions before I know if the system does achieve long term profitable (most importantly reproducible for an NN) results. However the big achievement here is that this opens up a new way to explore neural networks. If the above initial setup is not profitable we could start playing with topology with the number of training examples, with the size of the images, etc. The information contained within the 50×50 images is pretty blurry, so most like it’s not as good as a 100×100, so we’ll probably need to go to higher resolutions if the amount of pixels do not provide enough information for proper training. In any case, the idea is exciting and the doors are now open to testing :o)
If you would like to learn more about neural network system design or how you too can design your own trading systems please consider joining Asirikuy.com, a website filled with educational videos, trading systems, development and a sound, honest and transparent approach towards automated trading in general . I hope you enjoyed this article ! :o)


Hey Daniel,
Congratulations! I’m sure you are one of a handful of people on the planet who have tried this approach. Excited to see where this is heading… I know I’m jumping a bit ahead but maybe you can introduce seasonality by means of coloring the bars…
Hi Franco,
Thank you for your post :o) Well after I have some solid results using black & white I can look into colours. However the size of the image would need to be much larger for this to work. Thanks again for posting,
Best Regards,
Daniel
Hi Daniel,
Quite a charming idea!
But you are marching at a very fast pace, it’s really difficult to follow every new discovery within asirikuy.
Please slow down a little!
Best,
Rodolfo
Hi Rodolfo,
Thank you for your post :o) And I’m not even getting started ! Hopefully we will achieve some really cool things this year,
Best Regards,
Daniel
Hi Daniel,
Congratulations on your additional major milestone!
Best regards,
Maxim
Thanks a lot for the post an congrats Maxim :o)
Hi Daniel,
have you done already some experiments with Hopefield NNs? These are mostly used with optical pattern recognition.
Best regards,
Fd
Hi Fd,
Thanks for the advice :o) I will look into it!
Best Regards,
Daniel
I am very interested in this series of posts on using neural nets in trading. Apart from using images of the candlestick chart itself as input, have you investigated using images of indicators?
Hi Dekalog,
Thank you for your post :o) I have only started testing this method but certainly you could test indicator images as well. Neural network training with images is a very flexible technique so there is definitely a ton of room to explore. I hope this answers your question,
Best Regards,
Daniel
Hi Daniel
I always look forward to your posts in my Google Reader list.
I’ve just bumped in to opencv.org today and thought of this post, I suspect you may have discovered it already and decided against it, but just in case you hadn’t you may find it useful.
regards