On a recent post I described a global trading systems that sought to generate profitable historical results on the 4 Forex majors during the past 20 years. The rules for this system are however difficult to understand, with lagging relationships that go way into the past and in no way use information from the past few bars. For example the third rule for the strategy used a Close[156] with Close[173] comparison which appears difficult to interpret and rather spurious for anyone looking at this trading strategy. What would a price change happening 156 trading days ago have anything to do with the price change today? Specially after price might have moved in any given direction after 156 days? These type of correlations – which I call “unlikely” – make us think that a trading system is going to fail under OS testing conditions because our minds cannot grasp the possibility of such a relationship being real, but is it real or not? Within today’s post I seek to go a little bit deeper into this matter, trying to show some evidence that depicts how a price action trading system’s lag correlates with out-of-sample results.
–

–
If I told you to trade a system that asked you to go long if the difference between the price of the last closed bar and the bar 25 days before was positive you probably wouldn’t think too long about what this strategy wanted to do or if there was anything spurious about this correlation. It is obvious to any experienced trader that this is a simple trend following strategy that attempts to benefit from short term market directionality. However what would happen if I told you to follow a system that goes long if the price difference between the close of bars 100 and 125 in the past was positive ? You would most likely cast a lot of doubt into this strategy. There seems to be no reasonable technical causality here, this system was most probably the result of data dredging and a spurious relationship that happened to exist in the past but has no possibility to succeed in the future. Is this actually true?
If lagging relationships tend to generate losing results – as longer lags would depict a higher probability for spurious correlations – then we should find a strong correlation between OS profitability and the lowest lag present within a trading strategy (1 rule systems). This would indicate that the longer in the past a relationship is found, the less relevant it is for current price action. In order to test this out I generated 600 systems using randomly distributed 4000/1500 day in-sample/out-of-sample periods within 1986-2014 EUR/USD data (max lag = 300). The systems were created in order to comply with an in-sample R^2 value of 0.9 and a 10 trades/year requirement, making them linear systems (in non-compounding test) under in-sample conditions. I made the OS period 1500 days in order to give a chance for any spurious correlations to show loses (as they have a higher chance of being profitable by mere luck within a short OS test). After this I then looked at the lowest lag Vs out-of-sample results.
–
–
What we see here is that there is no clear-cut correlation between the lowest lag of a trading strategy and its out-of-sample results (R=-0.26). There are systems with very large lowest lags (+200) that still show OS profitable results – even the highest tested – while there are systems with very small lowest lags (using up to the last bar) that show unprofitable OS trading results. However there is in fact some correlation between the lowest lag of a trading strategy and its OS performance. Beyond the 250 bar threshold, there are no correlations that actually turn out to be profitable in the OS. Price patterns that have lags that are so large are most probably spuriously correlated with price action (more rigorous testing would be needed to definitely conclude this), as their results correlate well with what is expected from a random variable (slowly losing money as a function of the spread). There is also an undeniably larger probability to find losing strategies in the OS under larger lags, meaning that the risk of spurious correlations does increase to some degree with longer lag relationships. However it is also interesting to note that there are some long lags for which there seems to be clustering of profitable OS strategies.
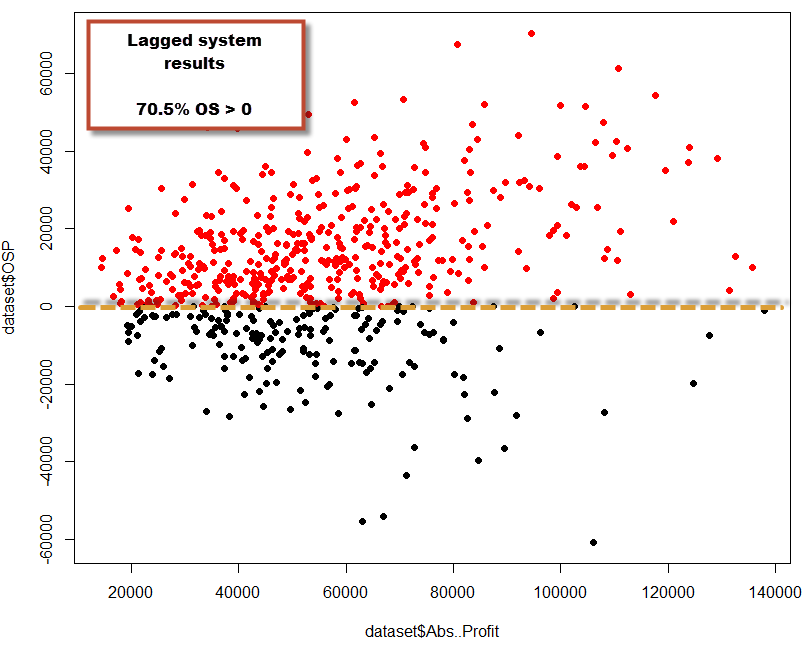
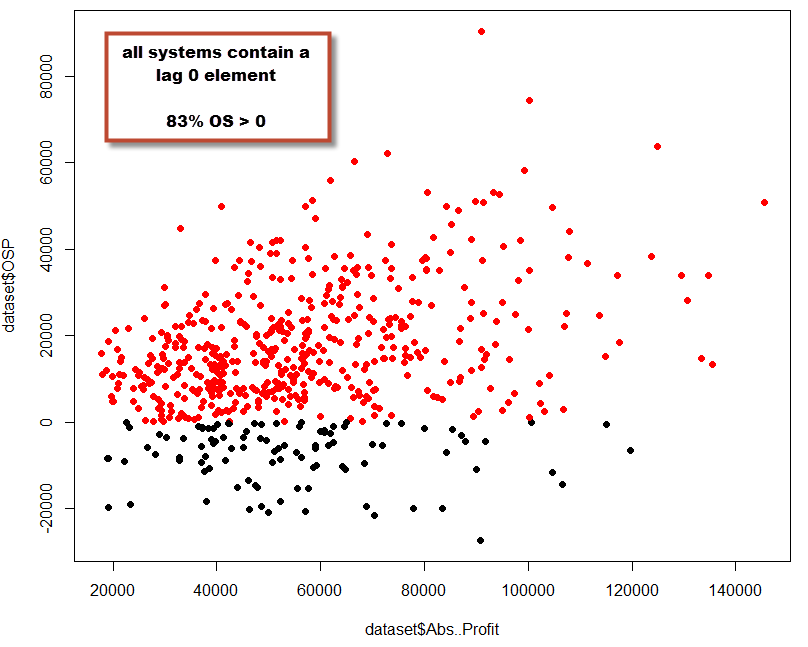
We can also look at the in-sample profit Vs out-of-sample profit from only lag zero systems (using data up to the last closed bar) and lag > 0 systems in order to find out whenever not using lag zero constitutes a dramatic disadvantage. To do this I performed two additional tests, one which generated 600 systems of only lag 0 strategies and another that generated 600 systems for lag > 0 only strategies. The results show that the OS profit Vs IS profit for both tests is similar. There is a larger probability to generate profitable OS results in the lag 0 test (83%) while the probability to generate a profitable OS strategy is lower for non-zero lag strategies (70%). However the probability to generate systems that are profitable in the OS is still well above that of a spuriously correlated variable for non-zero lag systems, showing that a non-zero lag does not constitute a guarantee for OS failure but the presence of a zero lag does constitute some advantage (at least it has been so historically for the EUR/USD on this specific evaluation case).
–
–
Last but not least, I wanted to talk a little bit about why there might be long lag causal relationships within a symbol like the EUR/USD. It is often easy to forget that there are many aspects of FX trading that are non-speculative, that is, there are many players in FX that do not care much about their gain/loss but only about the operative character of the FX market (they need to exchange EUR for USD, etc). This type of players can generate long lag valid causal relationships. For example imagine that there is a cash movement done every 120 days by a company that routinely exports/imports goods and this causes an up move within the FX market every 120 days. A data mining approach will eventually detect that when the Close[119]>Open[119] we should go long, because this means that historically price has moved up after that — in this case for a very real causal relationship, based on a real world effect caused by a market player. There are many other similar examples that could cause such lagged effects that could lead to useful trading systems.
Although the above analysis is far from being conclusive, it does point to the fact that generating systems that use small lags is a good idea but it also shows that some systems with large lags can be OS profitable above the profitability expected from a spurious correlation that just got lucky. In this test lags above 40 start to carry a significant probability of lower OS profitability while lags above 250 most likely generate only spurious correlations (although there are too few samples at these lags to say anything). In the future it would also be interesting to study whether having several rules (from which one has a low lag and another has a large lag) leads to better or worse OS results historically. Note that the above results could be different for other symbols or time frames, the above only constitutes a small preliminary analysis on EUR/USD data.
If you would like to learn more about trading systems and how you too can learn to develop your own strategies using data mining and other techniques please consider joining Asirikuy.com, a website filled with educational videos, trading systems, development and a sound, honest and transparent approach towards automated trading in general . I hope you enjoyed this article ! :o)


Hi Daniel,
With great interest I’m following your attempt to provide rational for spurious correlations. But I would first like to note that you avoided discussing the fact that another poster and I pointed to – that basically the system you described includes 6 variables (plus the exists) and it is not parameter-less as you claimed. The reason you found results with spurious correlations – because they cannot be anything else – that worked in OS is because of data snooping bias. You tried the Kantu system many times with the same data until you found something that worked. Your OS is not a true OS but actually a part of you IS. This is why you think – innocently I believe – that there is something into these totally weird relationships when in fact you have curve-fitted a system with 6 parameters to historical data via data-snooping. Note that the performance of the system you posted does not even worth mentioning in my opinion.
I would like to tell you Daniel that I appreciate greatly your technical abilities, your programming skills and unique capabilities of leaning new software. You are a very smart man. But my opinion is that your approach to this whole thing is conceptually wrong. I would suggest one approach to estimating your data mining bias: create synthetic random data for 4 pairs going 20 years back and then let Kantu search for a system. The performance of the very best system is your data mining bias. Then use Kantu again on actual full history with no need to do the OS and try to find a system that exceeds this best random performance by a sufficient factor to justify trading. If you cannot, throw Kantu away and move on. Otherwise, you will be here after 2 years complaining that systems do not work in the future. Good luck, you deserve it.
Hi Bob,
Thanks for your post and advice :o)
I would disagree with this because I only generated 5 systems with in sample R^2 > 0.9 (my filtering criteria) and from these I selected the top in-sample performer without looking at the OS results. I have no snooping bias as I never used the OS period for selection (please let me know if you think this procedure leads to snooping bias). In fact, the performance of the 5 systems I obtained was fairly similar (they were not correlated, so they are not variations of a similar strategy as well). Since I never looked at the OS data before the system was selected I am not sure how this constitutes data-snooping bias (clearly if I had looked into the OS for selection I would have no OS but an extended IS).
That is an interesting proposition. Do you think that synthetic instrument data is needed or would finding the best system using a random variable (purely spurious correlations) be enough? What would be the difference between both approaches?
Last but not least, I would like to say that I really enjoy your comments as well. I know that you intend them as constructive criticism which I am very happy to read, think about and use to become a better trader and blogger :o) Thanks a lot for reading and posting,
Best Regards,
Daniel
I think I would start by posting the data files used in this analysis in separate folders, the IS and OS, so that people can verify the results. This is important in my opinion as different forex vendors have different data series.
You wrote: ” I selected the top in-sample performer without looking at the OS results.”
I assume that you understand that selecting the best performers introduces data mining bias (see White’s reality check). Data-snooping bias is also present because you have been involved with forex system development for some tine now. This is a subtle point that must be understood. During this development time you rejected many systems that did not perform well in the OS and you repeated the development process. At some point, maybe just now, you were bound to find a system that performs well in the OS by luck. Had it not performed well, you would have not published the results and you would have gone on repeating this exercise. Although Kantu may not have used the OS to restart the development (pending verification), you have essentially simulated this procedure yourself over the time period you are developing forex systems and reporting only on the results that work well.
By now you have realized that I am actually trying to help. Yes it is important to run Kantu on purely random data to see what is generates. The maximum of the random performance is your minimum data mining bias.
Hi Bob,
Thanks for replying :o) Very interesting, I hadn’t considered my whole process and knowledge as a possible snooping source. You’re right in that posting IS/OS files in the future may be helpful so that you and others can help me see problems with my experiments. I will perform your data mining bias exercise as suggested and will write a blog article based on my results. Thanks again for posting Bob,
Best Regards,
Daniel
http://papers.ssrn.com/sol3/papers.cfm?abstract_id=2308659
This paper goes over a bunch of the risks of backtesting. He also gave a talk where he outlined a method for determining the likelihood of a system being overfitted, based on its mean “out-of-sample” performance following a series of permuted symmetric cross-validation tests on chunked data.
Bob is correct, though, any attempt to develop a system to search for systems is fraught with danger. This is why it is so important when doing ANY sort of machine learning to properly select the features that you have a strong *prior* suspicion of predictiveness, or at the very least, relevance. The more backtests you explicitly or implicitly (as Bob mentions above) you execute, the LESS you can trust any result you get. Since there is not enough financial data to follow an out-of-sample data-burning procedure without running out, you just have to be very skeptical and rely on a priori market knowledge to avoid fitting to noise.
Thanks a lot for the comment and paper link, I’ll surely check it out soon :o)
[…] week Bob – an avid and frequent reader – posted a comment with a suggestion involving the generation of random financial time series in order to generate an […]