Trading system failure is one of the most important areas in algorithmic trading because it deals with the different mechanisms that allow traders to remove trading strategies before they generate large loses on trading accounts. In markets like Forex, trading system failure detection and prompt removal are critical because failing to remove a system that no longer has a positive expectancy can result in heavy loses as time goes by. However the definition of system failure is not precise and depends on how much confidence a trader wants in judging that a system has lost its statistical edge. There are also several ways in which the “loss of an edge” can happen, depending on which aspect of the system’s statistical body behave abnormally against new market conditions. On today’s article we will be discussing some of the ways in which highly linear trading systems can fail and what tools can help us detect if these failure happens as well as the inevitable risk of making a false positive judgement.
–
–
Let us first start by defining system failure. For this article I will be taking about system failure as an evolution of a system’s statistical characteristics such that the system’s distribution of returns can be considered fundamentally different from the distribution of returns obtained form historical results with a 95% confidence level. This means that we need to establish some statistical thresholds that the system cannot breach and we must then declare failure as soon as these levels are breached. Note that these levels must also evolve as the trading system gets as history is expanded, in such a way that a trader can also quit a strategy or reduce risk if the thresholds for removing the strategy become too deep.
There are many variables that can be considered to diagnose system failure, among them we can consider the maximum drawdown, the maximum drawdown length, the number of consecutive loses, etc. Another extremely important measure is the speed with which drawdowns are reached. It is obviously not the same for a trading system to reach a 20% drawdown in 2 years against reaching a 20% drawdown in 10 days. A system might be behaving within its expected characteristics if it takes 2 years to reach a 20% drawdown while it might be discarded very easily if it reaches a deep drawdown period very fast. A deep and fast drawdown might be enough to diagnose system failure because the historical distribution of returns might be unable to reach that drawdown depth within that trade number.
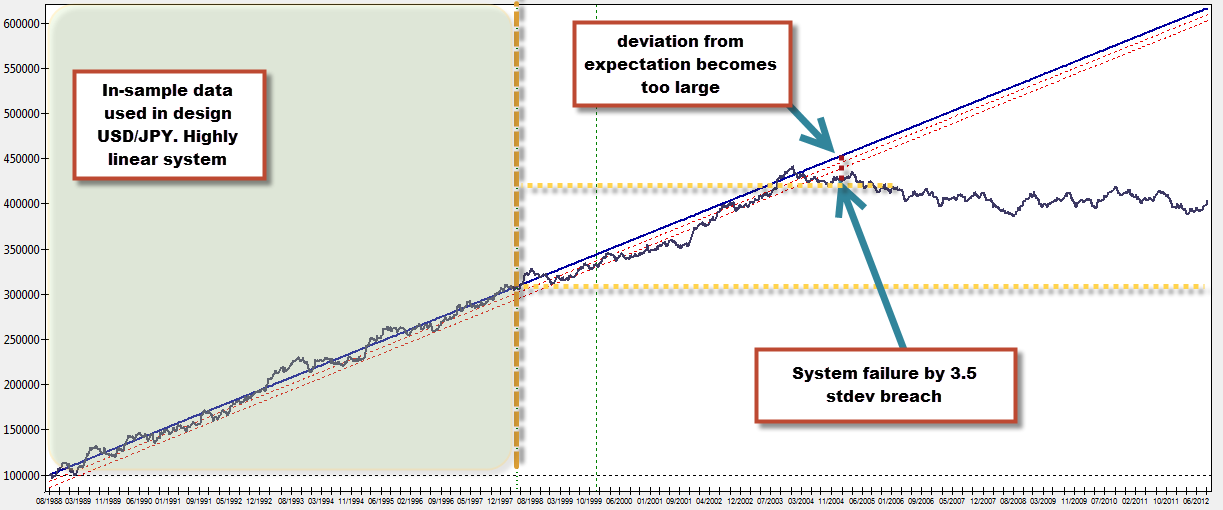
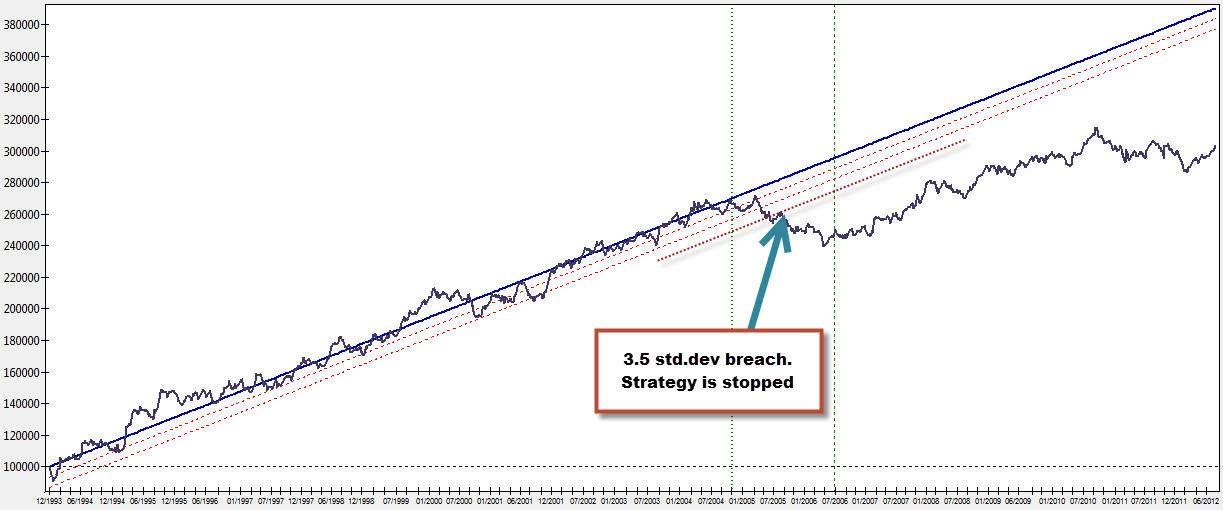
Monte Carlo simulations allow us to obtain the above thresholds very easily for any given trading strategy (provided the strategies have no serial correlation) but we can also employ a much simpler model for strategies that have highly linear characteristics. For highly linear systems we can use the linear regression of a non-compounding test in order to determine failure thresholds. We can also use simpler criteria – such as a breach of a given multiple of the standard deviation of residuals – in order to discard a strategy as being too deviated from the linear model. The standard deviation breach test is very useful to quit systems that have pronounced drawdown periods, as the standard deviation breach is naturally prepared to deal with fast excursions towards the downside and discard a strategy quickly. On the other hand, the standard deviation breach technique is also useful to prevent exceedingly long drawdown lengths, as systems will be discarded if their equity curve moves horizontally while the linear regression expects a progression towards the upside.
Statistically we would want to use at least a 3-3.5 standard deviation multiple in order to discard a trading strategy with enough confidence as discarding on lower multiples can lead to very premature quitting. A good way to assess how good the standard deviation barrier is can also be to look at the maximum standard deviation breach of the regression line within back-tests and see whether the chosen level constitutes a realistic boundary for a statistical worst case. In general a highly linear system (R^2 > 0.98) won’t have any breach above the 2.5 multiple of the standard deviation and systems with larger breaches should be considered carefully as the probability of sharp downside excursions has already been present within the back-testing results.
–
–
Another way in which we can determine system failure on linear systems is to carry out new regressions as time goes by including new data. A system that had a very linear profile with a very high correlation coefficient will inevitably start to lose this linearity as time goes by, if the R^2 coefficient drops below a defined threshold for linearity (for example 0.95) the system can be stopped from trading. The IR (Ideal R) can also be used to carry out a similar test, a drop in the ideal R would imply that the system is losing linearity and should be discarded. The IR is also faster reacting than the traditional R used in linear regressions and should therefore allow for faster discarding at breaches of acceptable levels.
http://dnasab.net/2007/09/ It is important to remember that a system fitting a linear model must also match all the statistical requirements for lineal behavior. These include linearity (relationship between time and balance should be proportional), independence (no serial correlation), Ware homoscedasticity of errors (constant variance) and normality of the error distribution. A breach of any of these characteristics implies a breach of linear behavior and with this the discarding of the trading strategy should be considered. As time progresses the model can be expanded to include new data and the error distribution, error variance and correlation coefficient (linearity) can be examined to determine whether the system has become non-linear in nature.
Highly linear systems – besides their higher historical expectation of positive OS results – allow us to use simpler models to determine system failure that do not require the use of computationally more intensive methods (such as Monte Carlo simulations). The linear model can easily be expanded on new data and the current situation of the strategy can be easily evaluated. If you would like to learn more about building highly linear systems and trading them within a powerful and professional C framework please consider joining Asirikuy.com, a website filled with educational videos, trading systems, development and a sound, honest and transparent approach towards automated trading in general . I hope you enjoyed this article ! :o)


Statisics is always my weaknes and that is main hudle currently I face when it comes to understanding such failure. Thanks for your easy explaination.