Designing trading systems that succeed under unknown market conditions while controlling risk is the main objective of professional algorithmic traders. However, the trading system design process is not straightforward and the question of what can lead to better out-of-sample (OS) performance is extremely important. Finding in-sample variables that may correlate very well with future success under OS conditions is one of the main goals of any system designer. Through my experience during the past few years I have found that high in-sample system linearity correlates extremely well with positive OS performance. During this post I will talk a little bit more about system linearity, how it is evaluated, why it is so important and why it tends to lead to historically favorable results.
–
–
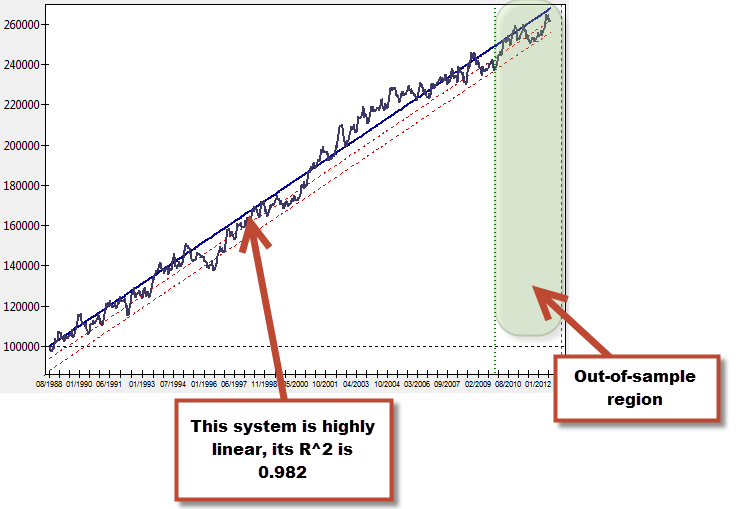
What do I mean by linear results? A system that is highly linear under in-sample conditions has an equity curve – in a non-compounding test – that resembles a straight line as closely as possible. The trading system showed on the image above has such a balance curve. In order to evaluate how closely our systems fits the linear model we generally use a linear regression – fixed at the origin, which is the initial balance – to give us an idea of how closely our system’s balance curve resembles a straight line. In the system above, the R squared correlation coefficient (which tells us how good our data fits the model) gives us a value of 0.982. This means that the above balance curve fits a linear model in an extremely close fashion, allowing us to model our trading system as a simple straight line.
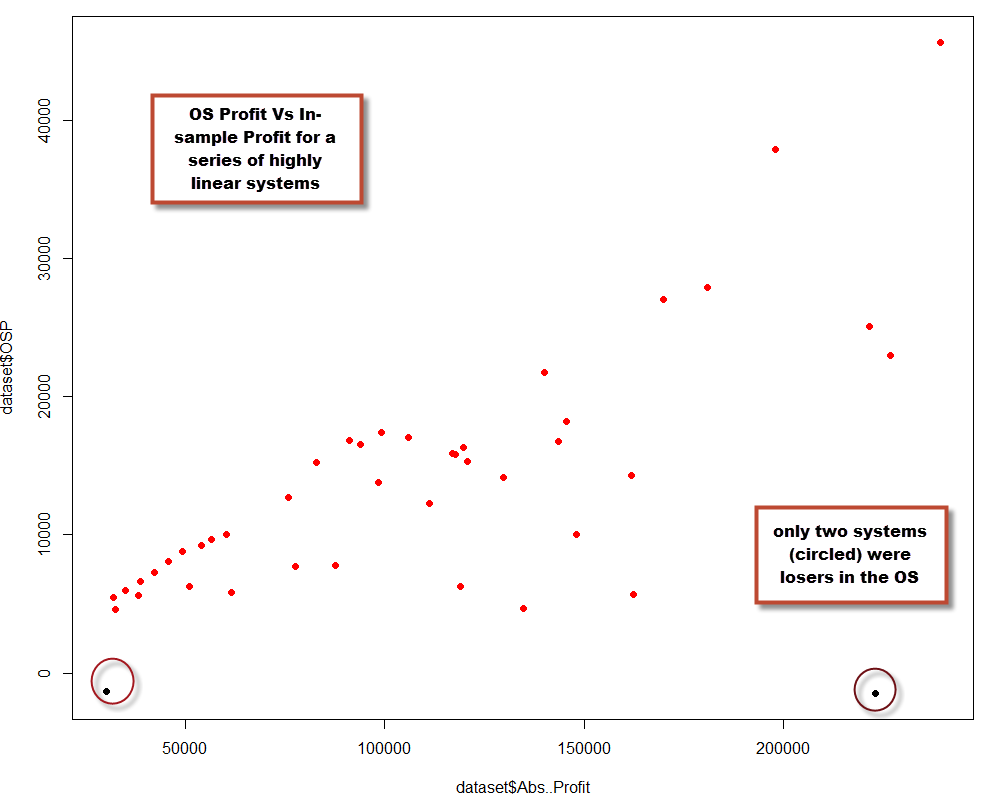
But how “highly linear” must a system be in order to correlate with OS success? The linear regression model has some problems that make the R squared coefficient a poor predictor for all but the highest values. The issue relates with the fact that the linear model compensates errors around the line, meaning that high standard deviations do not correlate well with poor linear fits. For example if you generate systems that have an R squared coefficient of 0.9-0.95, you will see that they still have a very high chance to fail in the OS. This is because a trading system can fit a linear model very well, but the standard deviation of the strategy can be high enough for the system to be a poor performer in the OS. The standard deviation relates with the system’s overall volatility, showing us its historical tendency to reach extreme equity high/low values which is often correlated with a tendency to fail in the OS. If you’re looking for a linear system using a regular linear regression, a coefficient of 0.98 or higher is required to ensure that your system is truly linear and with a low standard deviation. When you do this you’ll find high chances of historical OS success. For example a test performed within Kantu shows that for 100 EUR/USD daily systems generated with 1988-2010 data and out-of-sample tested from 2010-2013 with R squared greater than 0.98, the probability of OS success was 95%. These systems are however very hard to find (the search involved more than 14 million system candidates).
–

–
Why is very highly linear behavior leading to a good chance of OS success? There are several potential reasons why this is the case. The first is probably that highly linear behavior eliminates – almost completely – the possibility of having spurious historical correlations. Finding a system with an R squared higher than 0.98 using a random variable with a statistically relevant trading frequency (at least 10 trades/year) is almost impossible (probability in the 1 over billions). By having highly linear systems created over a long period of time (+15 years) you ensure (almost) that your system matches a historically real causal relationship within the price series. Another reason why OS success is increased so much is related to the fact that your system is “stable” along the whole price series. By stable I mean that the results for your trading strategy look similar, regardless of all the different market conditions the system went through.
–
–
There are also ways in which we can improve our measurement of a system’s linearity. The regular statistical linear fit model is a poor predictor for OS success overall (except for very high values as noted above) because of its natural compensation of deviations around the regression line, provided that these deviations are symmetric. However we can create a more complex model using several different linear regressions in order to come up with a model that better predicts system linearity. My July 2013 Currency Trader Magazine article (Measuring system quality with “Ideal R”) shows you how to implement a calculation that gives a much more accurate IR (Ideal R) statistic that has a much better measure of system linearity that is much more highly correlated with system OS success.
Looking for systems that are very highly linear using a regular statistical model is a good way to potentially get a higher probability of OS success, although a better model (like the Ideal R) can be more predictive of future performance. If you would like to learn more about algorithmic system creations and how you too can create highly linear system using Kantu please consider joining Asirikuy.com, a website filled with educational videos, trading systems, development and a sound, honest and transparent approach towards automated trading in general . I hope you enjoyed this article ! :o)


