Forex is perhaps the hardest market to trade in modern financial times. It’s a market with no long term fixed bias, no central exchange , low entry requirements and very high leverage, the absolutely perfect combination of efficiency and easy-access that makes it such a high risk investment for retail traders. Since most Forex retail traders lose their initial investment, it is not very far fetched to think that most traders don’t have a statistical edge and simply trade on a pseudo-random manner that ends up generating a negatively biased random walk that in the long term eats up their capital due to spread costs. However it is certainly possible for many of these retail traders to generate some return in the medium/long term based simply on luck. Today we are going to get a glimpse of how a sample of traders using random entries would behave, what their statistical distribution would be and why it is certainly reasonable to expect most traders in FX to lose money when they engage in random entries, regardless of their money management behavior.
–
–
In order to study random trading I have coded a simple system that enters trades based on a given entry probability. Trades have a 50/50 chance of being long/short and a trade has an overall probability of 10% to be entered on any given 1H bar. Trades are entered with a fixed 100 pip take profit and 50 pip stop-loss (a 1:2 risk to reward ratio most favored by advice on the internet) and the lot size remains constant at 0.1 lots per trade with an initial 100,000 balance. This represents a 0.05% risk of the initial capital per trade, which is the rather conservative approach that someone new to trading with 100K would be most rationally inclined to adopt (not that this is the case for many real traders). I then proceeded to execute the system 10,000 times, in order to obtain a convergent distribution of trading results that would be expected from this sampling. The tests were carried out on EUR/USD data from 2000 to 2014, giving us 14 years of trading under the above mentioned conditions.
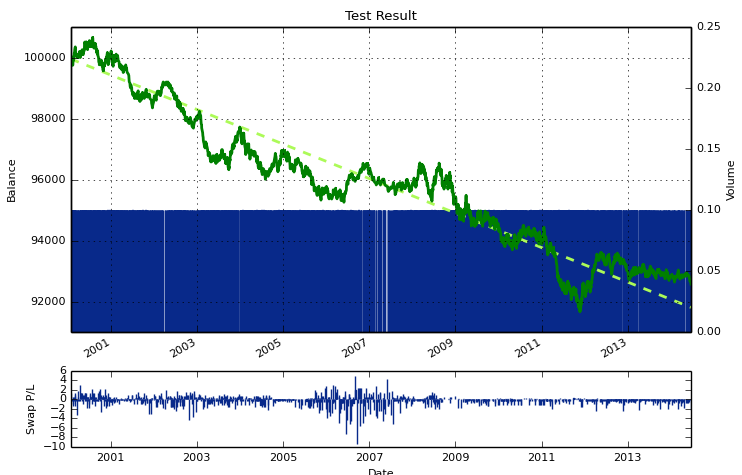
There are many interesting results within the above trading scheme. The above image shows you a sample system run from the 10,000 generated. This is perhaps one of the most typical outcomes, the trader goes through a negatively biased random walk that has periods of spurious profit that tend to last about 3-6 months but that ultimately resolve negatively, always reaching new equity lows. Not surprisingly the risk is so low and the spread is so small (just 3 pips) that the overall negative bias is not enough to drive any of the 10K tests to a bankruptcy scenario. Even if we were trading at a 10x risk (0.5% of initial capital per trade) we would still avoid a wipeout within ten years of about 95% of the trading accounts.
–
–
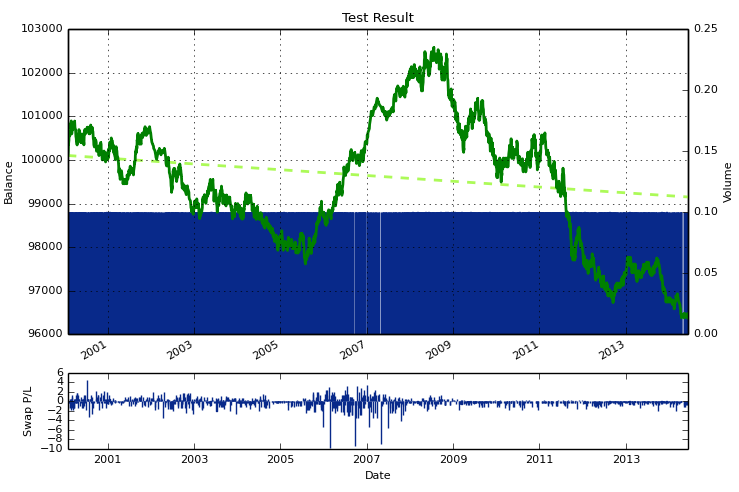
There are however many other cases were we are much more easily fooled by randomness. Take a look at the second scenario, where we have a period of about 3 years where the account made a lot of profit, although trading was completely random. This may explain why a significant portion of traders may believe they have some sort of edge but then they end up losing completely as the natural negative bias of the random walk starts to hold true. Certainly the probability of such deviations grows smaller as the deviations grow bigger/longer but they are still likely to exist, even on streaks as long as 2-3 years. The probability to have a positive year within 10 years of random trading are in fact significantly high, about 50% of accounts experienced such a scenario. A consecutive 3 year winning streak is much less likely, although still quite possible (around 5% probability).
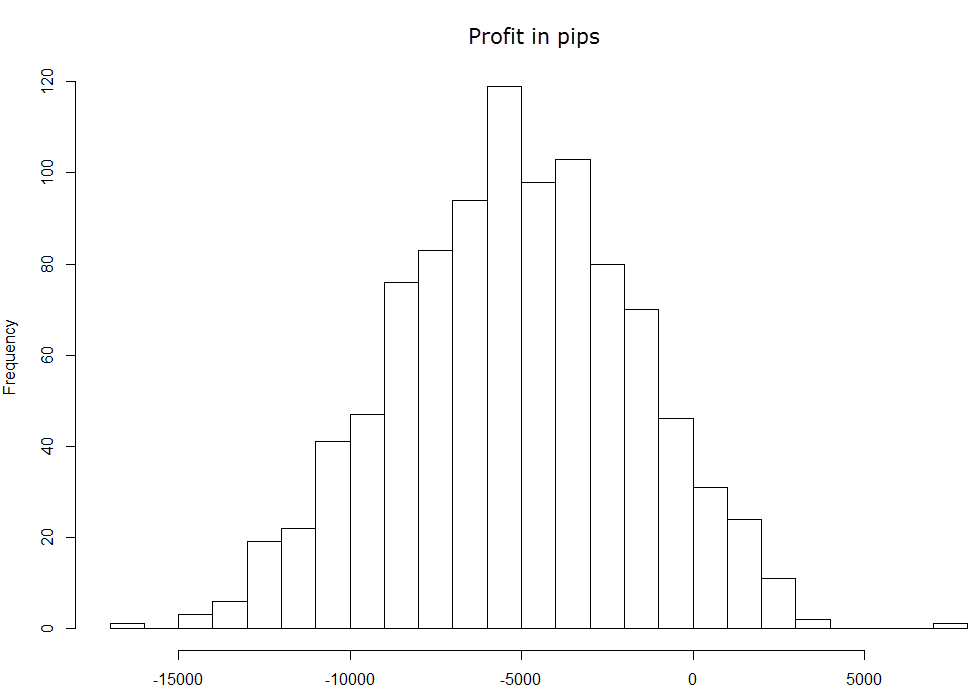
It is actually quite enlightening to look at the distribution of profits (in pips since we’re trading constant lots) for the 10K tests. We can see that the results are not normally distributed (fails a Shapiro-Wilk test) as there are significantly fat tails, owed primarily due to the character of the FX data which in itself is not normally distributed. The highest frequency within the test is around a loss of 5000 pips, since the average trades/run is about 2500 this represents a negative bias that is close to 2 pips, which is the 70% of the spread that you would expect to become evident within the test parameters, since randomness allows for this to happen. Under a much longer test we would expect the mean to converge to a 3 pip/trade loss but probably not before account funds would be exhausted.
–
–
Notice however that some fraction of tests actually make a significant profit within a 10 year interval. We have about 1% of cases that end up in positive territory and from these we have at least a 0.01% that ends up with a profit above 5000 pips. The minimum drawdown period length is still quite high (1140 days) and the maximum pearson correlation coefficient is still quite low (0.84). In fact these two variables constitute a quite powerful method to distinguish random outcomes from outcomes with an edge since the achievement of random outcomes with values that are beyond the 4x standard deviation from the mean for these values would be extremely unlikely as the systems would be extremely linear and their loses too infrequent for them to be the product of a random walk. However it is still clear from these results that someone trading randomly can achieve a profit even after a 10 year trading interval, showing why you can still be fooled incredibly well by randomness.
When you use other position or money management schemes, in the end you get something similar although you can control how extreme the variations are in the short term according to how your money management works. For example if you’re using a Martingale type money management you can make losing scenarios much more prominent while you increase the probability of long winning streaks. In the end this acts simply as a way to make a bet with the same overall odds as the negatively biased random walk in which the risk and reward are much more extreme, something rather similar can be achieved by increasing the stakes in the regular random walk approach.
From here you can see that trading randomly does not imply that you will lose money in the long term. Although this is the biggest probability (about 99%) it is true that you can still achieve profits by trading randomly if you are just lucky, even across a 10 year period. Due to this reason it’s important to take care not to trade systems that are just being fooled by randomness and to ensure that your trading systems and/or manual outcomes have a true statistical edge that would be extremely improbable while following a random trading scenario. Exercises like this – building distributions from random outcomes – are very useful as they allow you to see how easily a trader can be fooled by randomness in the short term and how different parameters for the test can have a dramatic effect in overall odds and short term results.
If you would like to learn more about trading and how you too can develop systems that have historical results above those expected from randomness please consider joining Asirikuy.com, a website filled with educational videos, trading systems, development and a sound, honest and transparent approach towards automated trading in general . I hope you enjoyed this article ! :o)


Great read…thanks for posting!