I have written several posts in the past about real out-of-sample predictions and how it hasn’t been possible up until now – at least for me – to find any variables that can reliably predict short term out of sample performance (for example predicting the Sharpe ratio for the next year). I routinely carry out new experiments as new data comes in, hoping I will be able to create a model that leads to some degree of accurate prediction, but so far I haven’t been able to predict the variables that are the most interesting for us as traders. However during my last few experiments I realized that there are some things we can actually predict from in-sample data that can help us select trading strategies to some extent. On today’s post we are going to talk about these variables and why it seems that they can be predicted significantly in the out-of-sample.
–

–
The holy grail of trading would be to find some in-sample|out-of-sample relationship that would allow you to reliably pick top-performers – or at the very least profitable performers – from a pool of systems based solely on how they behaved under historical trading conditions. Since this information is so valuable what we find is that the market becomes efficient to it and it becomes practically impossible to predict the short term statistics of a strategy going forward. I have indeed found significant evidence supporting that long term stable performers tend to be profitable in the long term but which ones will be profitable within the next year or two years is something that I have yet been unable to predict.
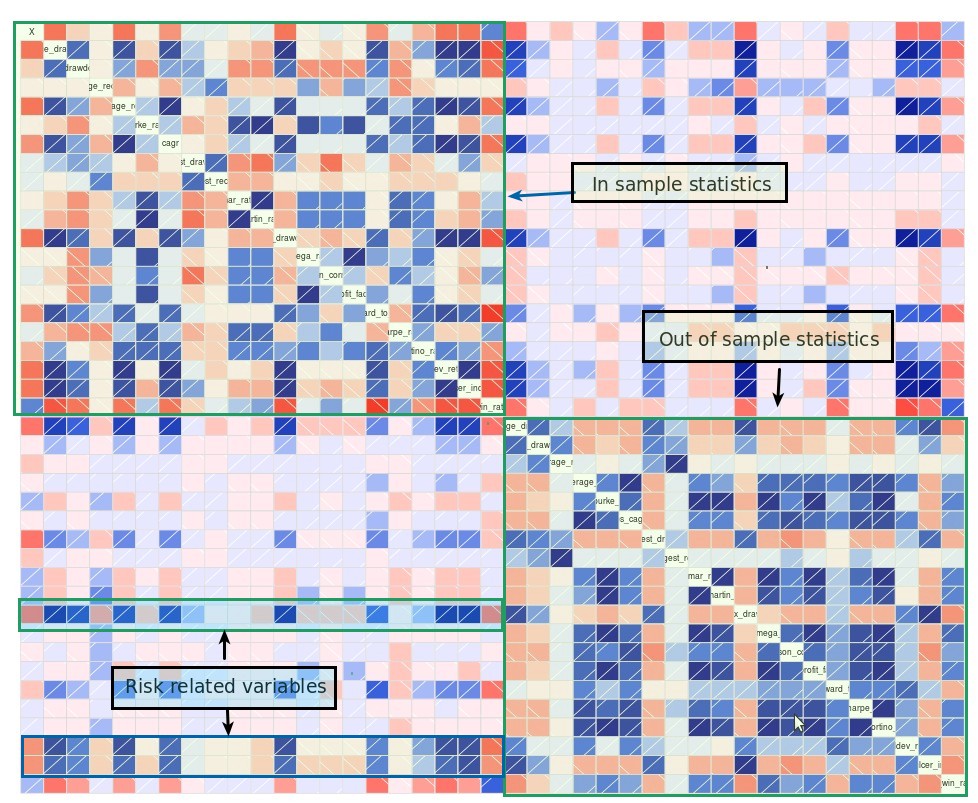
Taking 400 uncorrelated price action based strategies – all with at least one year of trading history – and measuring the correlation between their out of sample and in-sample statistics we find the results showed above (darker blue means higher positive correlation, darker red means higher negative correlation). The in-sample and out-of-sample variables show strong correlations between themselves – which is expected – while the correlations between both groups is very limited and very rarely goes above the 0.2 mark (which is what you would expect from random chance). The relationships between variables like the in-sample Sharpe ratio and the out-of-sample Sharpe ratio are exceedingly faint, reason why at this point – with a little bit more than 1 year of data – we can say that the relationship between both Sharpes is in the best case non-linear – which I doubt as machine learning models also fail to find relationships – and in the worst case non-existent for this time horizon.
–

–
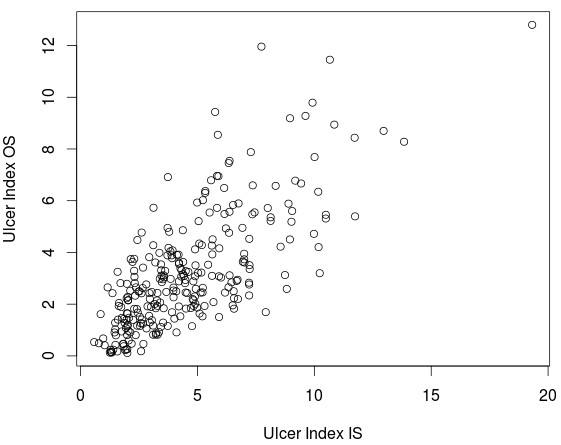
However there are some interesting cases where the correlation goes up and in some cases correlations are even higher than 0.78. These are variables that we can reliably predict going from in-sample to out-of-sample conditions, at least we can establish that these variables have a directly proportional relationship which means that ranks of systems in these variables in the in-sample data are bound to be similar when we go to live trading. These variables are related to risk and trading frequency and are usually things like the Ulcer Index, the standard deviation of returns, the average number of trades, etc. This means that more risky systems remain more risky in the out-of-sample and less risky systems behave in a less risky manner. It also means that the relative frequency of entry criteria remains basically the same between both sets, although the in-sample and out-of-sample conditions are different.
Of course the above is of limited usefulness which is precisely why there doesn’t seem to be an issue predicting these variables. This means that when predicting something like the Martin ratio the hard part is not to predict the Ulcer Index but to predict the mean return which is precisely what is most interesting for us as traders. Being able to predict risk means that the differences in terms of risk-adjusted rankings will depend on predicting mean returns, which is precisely what we can’t seem to know in advance. However knowing that risk has strong in-sample|out-of-sample relationships for these systems is encouraging since it means that we won’t get surprises in terms of high increases in risk going forward, which is extremely important when trading.
–

–
Unfortunately this discovery does not aid us much in terms of being able to select systems but it does show us that not everything we see in the in-sample changes when we go to the out-of-sample, even in a relatively short term out-of-sample period. While it continues to be very hard to predict out-of-sample profit-related variables it may become possible as we gather more data since the variability of profit related variables in the short-term – bear in mind that in this case the in-sample is 30 years long – can be very large. If you would like to learn more about automated trading and how you too can learn to create strategies and build protfolios please consider joining Asirikuy.com, a website filled with educational videos, trading systems, development and a sound, honest and transparent approach towards automated trading.strategies


