When you analyze the performance of the turtle trading system for the past 10 years (jan 2000 to Jan 2010) on separate instruments things do not appear to look that good for most pairs. The EUR/USD is the only one that gives outstanding results while other pairs seem to struggle to make any profit or even to break even. However I have always been interested in the portfolio character of the turtle trading strategy and analyzing mixed performance along a basket of instruments becomes important to truly know how well positions taken on different pairs at different times affect the depth and extent of draw down cycles.
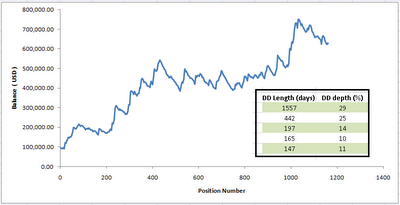
In what has appeared to be a portfolio centered week (certainly reading the past few posts you will know what I mean !) I decided that it would be great to show you some of the performance characteristics of a combined simulation of the turtle trading system No.2 on the EUR/USD, USD/CHF, GBP/USD, AUD/USD, NZD/USD and USD/JPY. I did not include any correlation or trade limiting rules and all instruments were traded with separate balances with each loss or profit made by an instance affecting exclusively its own position sizing. Using some scripts provided by Asirikuy members (thanks again for all your contributions by the way !) I was able to combine, reorganize and analyze all the backtests as if they were a single trading system. The results, which show us the potential of the Turtle Trading system, are shown below (small table shows largest draw down periods).
– –
–
The combination of all these different currency pairs generates a portfolio which was able to achieve in simulations an average 21% compounded average yearly profit with a maximum draw down level of 29%. As it is expected, draw down period lengths for this system are large with the biggest draw down period lasting about 4 years from2004 to 2008. However, the inclusion of different currency pairs meant that the trading system was able to preserve equity and avoid further dips under unfavorable market conditions characterized by a lack of well defined rapidly developing trends.
In the end I have to say that these results are encouraging and they point out that the inclusion of the additional portfolio rules may be able to improve profitability even further. Overall the turtle trading system seems to continue to be a reliable and robust trading system which – despite pronounced draw down periods – always seems to be able to come through to the other side regardless of ever-changing market conditions. The fact that trends always eventually develop – as a consequence of crowd behavior – seems to mark the long term success of this trading strategy.
If you would like to learn more about the turtle trading system and how you too can trade Ayotl or learn how to code your own long term profitable systems based on sound trading tactics please consider buying my ebook on automated trading or joining Asirikuy to receive all ebook purchase benefits, weekly updates, check the live accounts I am running with several expert advisors and get in the road towards long term success in the forex market using automated trading systems. I hope you enjoyed the article !


