–
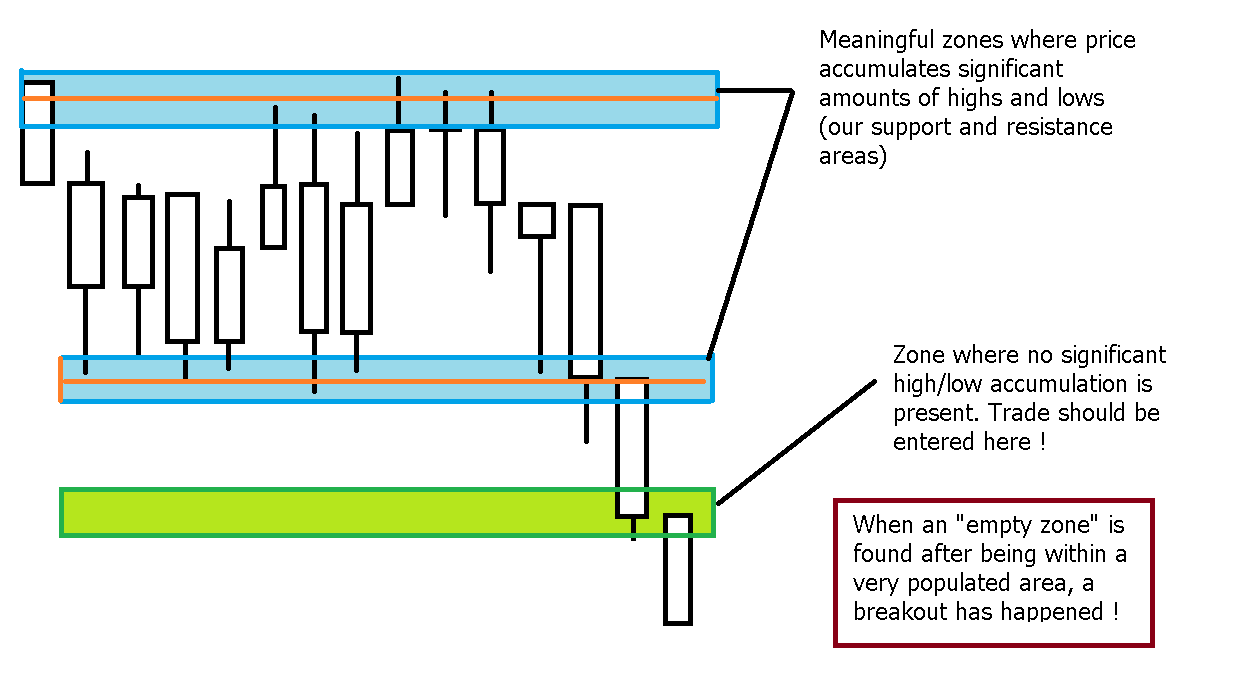 –
–The significance of these levels is then easily evaluated by the percentage population of each price level and we can easily measure if price is moving towards a zone with a high population or outside a zone with a high population. When price is trading within a highly populated area it will have a tendency to remain there while when price trades in a “population scarse zone” it will tend to go to a zone where more trading has happened in the past. As it is shown on the image above, we could create a system by entering a position after we “breakout” of a zone that has a high population value. It is good here to note that we don’t use levels but zones using a given amount of space to gather a given high/low population, this is done due to the fact that in forex trading support levels tend to be “spread” over a given area instead of pined to a given level (this is a consequence of not having a central exchange).
What is the result of implementing this S&R “tactic” on an expert advisor ? Eventhough the results of my first analysis are not absolutely incredible, it does reveal that the above given way of measuring S&R level and entering trades has some merit and – at least – a positive mathematical expectancy and some potential for profitability. The below image shows you the equity curve of an S&R system implementing the above explained criteria for entering breakouts of S&R levels (10 year backtesting period Jan-2000, Jan-2010).
– –
–
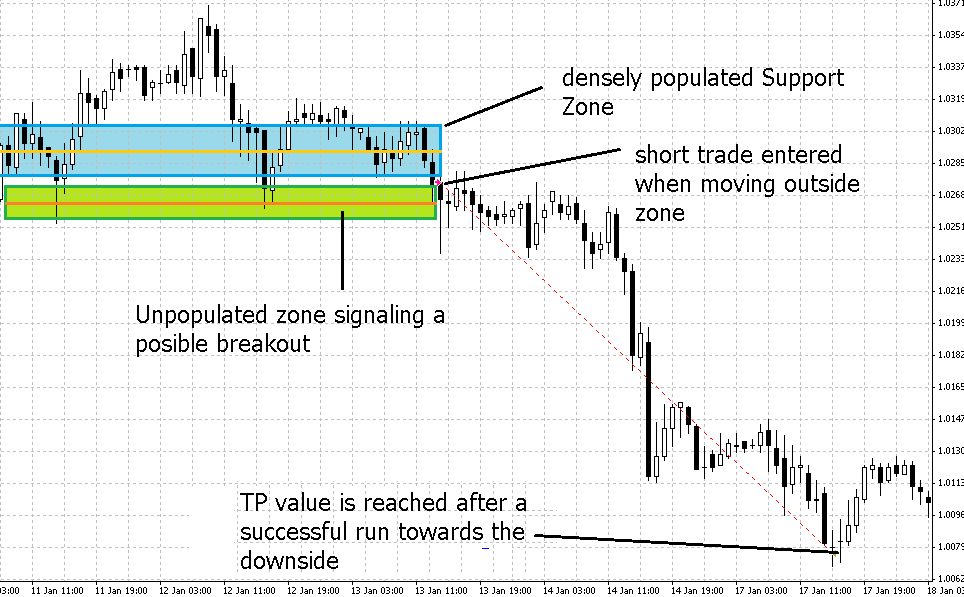
The system does most of the time what I intended it to do, entering trades after breakouts of S&R zones like it is shown on the image below. However the problem now becomes to know which period needs to be used to evaluate the S&R levels and what percentages are going to be required for any given S&R level to be considered important on different timeframes. As you may see, the population is an absolute number and we need to do a deep historical analysis to see what this number should exactly be to call a level “important or unimportant”. Nonetheless I consider this step a very important achievement since there is now a way to measure the population of a given price level and some mathematical criteria to establish its importance. I will continue to develop and improve this S&R technique and there will most certainly be an EA with it in the future :o).
– –
–
If you would like to learn more about automated trading and how you too can learn to use, design and implement your own likely long term profitable systems based on sound trading tactics please consider buying my ebook on automated trading or joining Asirikuy to receive all ebook purchase benefits, weekly updates, check the live accounts I am running with several expert advisors and get in the road towards long term success in the forex market using automated trading systems. I hope you enjoyed the article !


Daniel-
That's excellent work, thanks. A few ideas:
Regarding the lookback, you have the entire history of the pair. So instead of only looking back x bars, use the entire history of the pair. You can attenuate the influence of the older data by applying a "squashing function" that reduces the impact of older data, yet retains its influence, but to a lesser degree. This way price levels which were held in the past (even years ago) still have some influence on the S&R value.
Great job and let us know how it goes,
Chris
Hello Chris,
Thank you very much for your comment :o) Indeed and entire history lookup was my first idea but it turns out that the computational effort required to do this analysis is not trivial and any period beyond 50 days puts a huge amount of strain on the CPU, taking almost 12 hours for a one year backtest. The test you see uses a 50 day lookback period which takes long but not AS long. Using the whole history is just impossible with metatrader 4 due to this limitation.
For this reason I believe that we might not be able to implement this strategy fully on MT4 and probably MT5 (which is a ton faster) will be needed. Anyway, I am looking at the sensitivity of the lookback period and reviewing other approaches to see if I can get around this issue :o)
Thanks again for your comment and congrats. I'll keep on doing the best I can :o)
Best Regards,
Daniel
Daniel,
I'd like to propose an approach to computational complexity:
-Start with detecting weekly S/R.
-Search for "densed" areas on daily bars only in weeks, having enough population.
This could cut off the complexity.
Maxim
Hello Maxim,
Thank you for your input :o) I did try that ! The problem is mainly that when you want to use daily and weekly time frames you need to use the iLow and iHigh functions which increase computational effort a lot. Even if you only do 100th of the calculations , the calling of these functions makes it an even worse approach than the usual approach calling only High[], Low[] of hourly bars.
In the end, I believe that we will only be able to implement this in a reliable fashion on Metatrader 5. Thanks a lot for the comment Maxim :o)
Best Regards,
Daniel