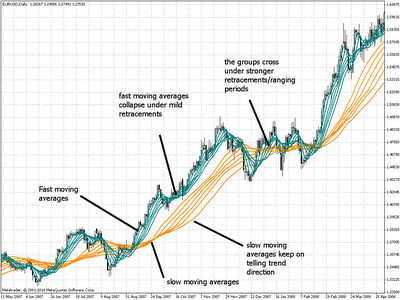
Obviously when you look at a chart – especially at strong trending periods – through the Guppy lens, things seem to align perfectly with what you would expect and trending price action seems to become crystal clear. Below you can see an example of such a period on the EUR/USD. You can notice perfectly how the fast moving average group “collapses” when we are within the retracement of a long term trend while the slow group remains showing us overall trend direction. Guppy Moving Average charts have always reminded me of noodle soups (because of all the lines and their interactions) reason why when I trade with Guppy’s indicator setup I like to refer to it as trading the noodle soup.
– –
–
However after you spend sometime studying the GMA and its actual use to create a real trading system which succeeds in time you will notice that it is not very straightforward to do. Although many websites on the internet talk about the GMA method, how to setup the charts and the general information given by the interaction of the moving averages none of them describes a real system which allows us to mechanically apply the GMA to obtain long term profitable results. As always it seems that all we have is some pretty noodle soups and no idea of how to interpret this information to arrive at a system that is able to exploit the information shown on the screen to our advantage.
It is fairly obvious that the GMA method is not without its problems and obviously this makes its mechanical application difficult at first. However after analyzing a lot of the characteristics of the GMA and the way the two groups of moving averages interact I was able to come up with a simple yet powerful system that allows us to exploit long term trading behavior within the daily charts in a mechanical way with precise sets of rules on several different currency pairs (ten year backtest of the EUR/USD shown below). This is indeed a fairly simple moving average based system (with the moving averages used by Guppy) that achieves profits in the long term (note that these simulations on daily charts are bound to very live/back testing consistent).
– –
–
The specifics of this trading system’s rules will however remain hidden for the moment as I believe this idea and its results will form part of a future Currency trader magazine article and they will be further polished to become a future Asirikuy trading system. If you would like to learn more about my automated trading systems and how you too can design and build your own reliable strategies with sound risk and profit targets please consider joining Asirikuy.com, a website filled with educational videos, trading systems, development and a sound, honest and transparent approach to trading systems. I hope you enjoyed this article ! :o)


Hello Daniel,
Did this system end up becoming an actual Asirikuy EA? Maybe the roots of Qualari?
At least, given the small information you gave in this post, it seems an EA with a low drawdown which could help in any porfolio.
Cannot be sure about the open drawdown though.
Hi Fernando,
Thank you for your comment :) No, this EA hasn’t become part of Asirikuy yet as I have still lots of work to do before this strategy is where I would want it to for our community. Quallaryi was implemented thanks to Fj (who suggested the time-filtering logic). I hope this answers your questions!
Best Regards,
Daniel
how ,where do i put the guppy method on my charts thehawkeye157@netzero.com
You are right about there not being a defined system out there to use the GMMA. But I am interested to know what is yours. Since this was published in 2010 you should have it figured out by now
Hi Karma,
Thanks for writing. I didn’t explore this a lot further but I did publish an article about this on currency trader magazine if you want to take a look (http://mechanicalforex.com/ctmag/ctmag_1110.pdf). Thanks again for commenting!
Best Regards,
Daniel