As I have said within some of my earlier posts about genetic programming and the Coatl genetic framework, one of the main advantages of Coatl is that its reliable use of control point simulations on daily time frames allows us to use very long term EOD data to carry out trading system simulations. Since one of our most important goals in automated trading system development is to build setups which can stand the test of time it becomes very important to build systems which are very robust and survive drastic changes in market conditions. On today’s post I am going to talk with you about the first Coatl portfolio developed within a period of 20 years, what it achieves, what it fails to achieve and how it compares with the 10 year portfolio discussed a few weeks ago.
For those of you who aren’t familiarized with Coatl it is the first genetic framework developed within Asirikuy, an MQL4 native implementation which allows users to create trading systems without any prior knowledge about the possible inefficiencies found within a given currency pair. Coatl generates systems based on genetic algorithm optimizations of the entry and exit logic of the system, finally generating systems which give profitable results on the target time frame/currency pair. The framework has been designed to avoid curve fitting as much as possible, using very coarse parameters changes and very simple entry and exit logic criteria with single indicator components.
–
My first objective with Coatl was to develop an 11 year system with 10 years of optimization plus 1 year of out of sample testing. After carrying out this task and achieving an AMR to Max draw down ratio above 3 it became clear that Coatl is able to build very profitable portfolios, bringing together systems on many different currency pairs. However I wanted to further explore the characteristics of this framework to see if I was able to develop systems across even larger time frames with an even larger out of sample testing period. The next challenge was to develop a portfolio using 10 years of data (1996-2006) and then run an out of sample test including the whole testing period (1990-2011).
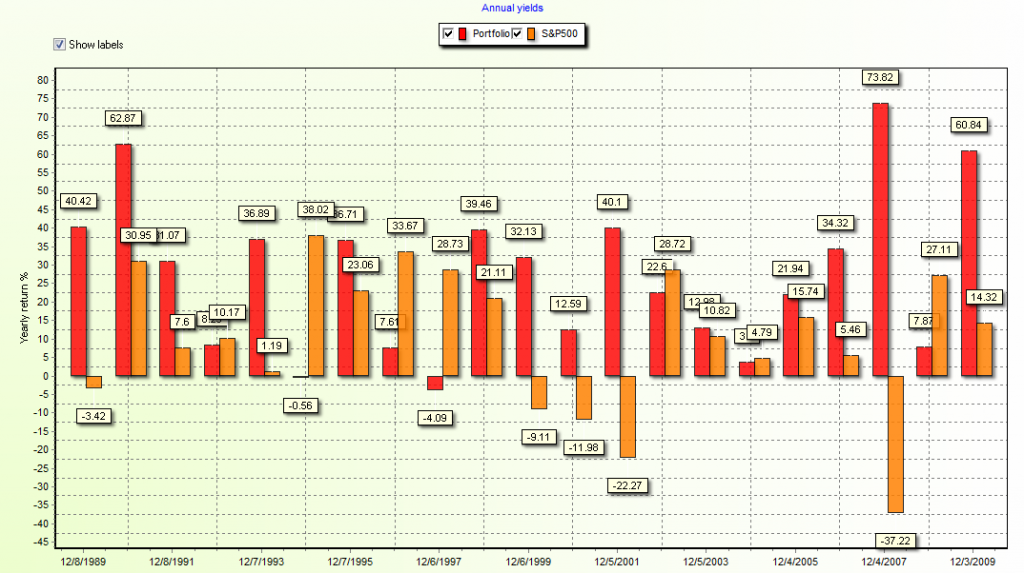
By carrying out the above process I was able to obtain a set of systems on 6 different currency pairs (those with complete EOD data back to 1990) which generates overall profitable results during a 21 year test. This portfolio is very robust by definition as it contains out of sample periods both before and after the in-sample period with both of these periods being surprisingly more profitable than the in-sample period I chose. The results of the portfolio clearly show that in the case of this type of design we sacrifice profitability for robustness with an AMR to Max draw down ratio of about 0.85. The portfolio has however a very good and even performance with only 2 unprofitable years (and just barely) during the 21 year period.
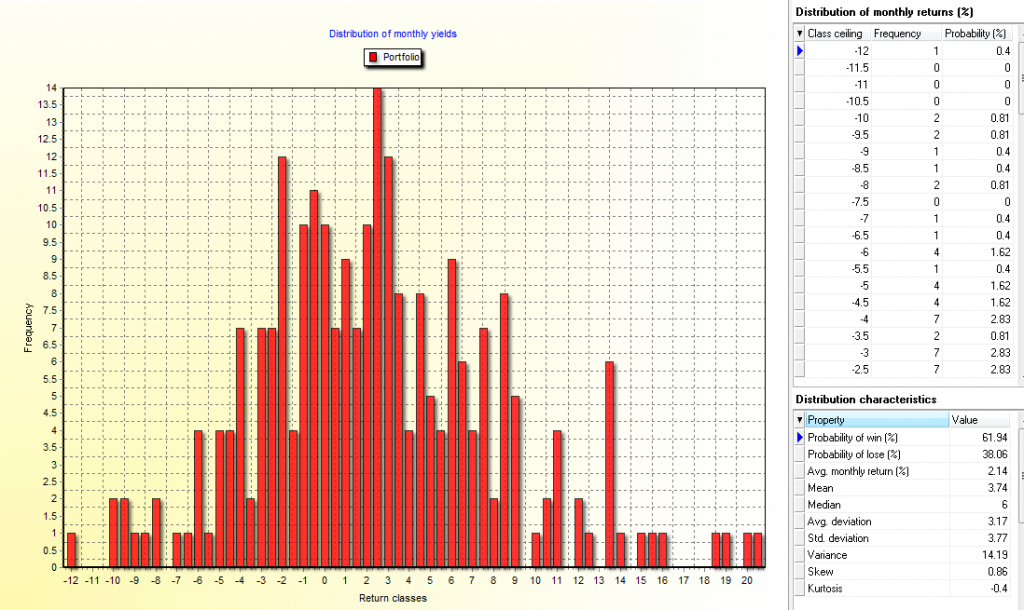
Another advantage of this portfolio is its distribution of monthly returns which shows we have a 61% probability of having a profitable month with a 39% probability of having a losing outcome. This means that we will have – in the long term – more profitable than losing months. The skewness and kurtosis of the portfolio are also pretty good with positive and negative values respectively showing that the distribution of returns is quite centered (less fat tail risk) and positively distributed (more profitable outcomes than losing ones).
A very interesting aspect is also to compare this portfolio with our previously developed 11 year portfolio. Both portfolios share many of their trading techniques and certain pairs – like the EUR/USD (note that DEM/USD data is used before 1999) – share almost the exact same make up on both portfolios (showing that the presence of the inefficiencies within this pair are rather constant through time). Other pairs like the USD/JPY and USD/CHF also share some criteria although there are some modifications between both, particularly – it seems – to better fit the 1996-2000 period. However overall results of this portfolio between 2000-2011 are less profitable than for the initial portfolio (less than half the AMR to Max Draw Down ratio) showing that sacrifices are made in order to attain a higher level of robustness.
–
–
Of course it is difficult to say which portfolio it is “better” to trade as it depends on what you want to give a higher priority. Certainly if a person trades the first portfolio they would have a chance at attaining a higher profit while those who trade the second may have a higher chance of having a lower profit for a longer time. Overall it depends on what your particular compromise between robustness and expected profitability is but I will certainly enjoy testing both portfolios to evaluate how they do in long term trading (and how they behave compared to one another). The parameters for this portfolio as well as all the back testing results will be published within Asirikuy during this Sunday.
Clearly it is also very important to understand that Coatl generated systems should NOT be treated as black boxes and that an in-depth understanding of how the framework works and how the generated systems trade is necessary for long term success. As always failure to use a system without understanding what it does is the easiest way to fall into psychological pitfalls, misunderstand the trading decisions made by the framework, etc. If you would like to learn more about my work with Coatl and how you too can learn how genetic programming works and how you can understand all the logic of the systems generated by it please consider joining Asirikuy.com, a website filled with educational videos, trading systems, development and a sound, honest and transparent approach towards automated trading in general . I hope you enjoyed this article ! :o)


