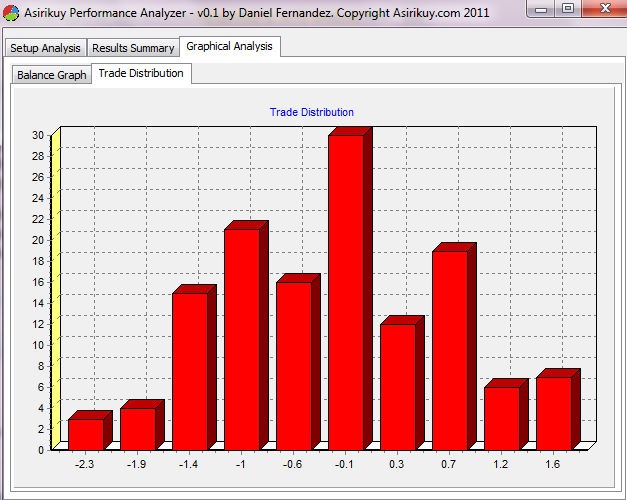
Those of you who are Asirikuy members or have followed my blog for a while may remember the EA analyzer indicator, our effort to come up with a solution to analyze trading systems directly on the MT4 platform displaying relevant statistical information such as maximum draw downs, maximum consecutive losses and trade distributions. Although this tool has been great – helping us analyze our trading results as they happen – it has several inconveniences which have prompted us to look for a better replacement which allows better flexibility and the ability to perform worst case comparisons in an easier fashion (against our Monte Carlo derived worst case value database). Today I am happy to introduce the Asirikuy Performance Analyzer, the next step in on-the-fly analysis of live results, especially designed for large platform setups were perhaps hundreds of instances need to be compared against worst cases.
The overall limitations of the EA analyzer indicator were evident as we started to use it more heavily. The first important limitation is graphical as in order to take a good look at the trade distribution histogram we needed to zoom a lot into the chart, something which wasn’t neither aesthetically pleasant nor convenient. The second and perhaps most important limitation pertains to the overall functionality of the indicator which does not allow us to save WC database IDs for comparison and required us to either keep a lot of indicators loaded (with the ugly chart setup required) or simply limit the extent of our analysis to certain systems. The third limitation was that the system did not show us a comprehensive list of the available system IDs which had been used and therefore the user had to have knowledge of which instances had been present with which magic numbers to setup the indicator successfully.
–
In order to overcome these problems and generate a much more powerful way to analyze our live trading results I have created the Asirikuy Performance Analyzer which is a Delphi based program that uses an absolute database solution in order to read and analyze the trading results of each account. A simple script saves this database after one execution on the MT4 platform and from here on the program can start analyzing the results. The user can save a list of MT4 folders which allows saving of each account’s separate information and can move through difference accounts by simply going through a drop down list. When the user selects a platform the database is loaded and all the magic numbers which have been used are displayed, allowing the user to select whichever ones he or she wishes to analyze.
Another great improvement over the EA analyzer indicator is that the user can save the system WC ID and Risk Unit information for each different magic number, allowing them to analyze if the worst case for their particular setup has been reached. In order to make this comparison procedure even easier I have implemented a “wide WC analysis mode” which evaluates if the WC scenarios for each separate instance ID or portfolio have been reached. In the end with one click you can see if any of the X instances you’re running on an account has reached its WC or if your portfolio as a whole has reached this point. Select another account from the drop down list and you’ll be able to analyze a completely different portfolio in a matter of seconds.
The performance analyzer also contains the same statistics displayed by the EA analyzer indicator allowing you to see important values such as the risk to reward ratio, winning percentage and maximum consecutive loss number. You also get graphic displays of both the trade distribution (distributed along a set number of classes you specify) as well as the balance change curve which allows you to see how the system you chose has evolved over time. The program also displays all analyzed trades in a spreadsheet allowing you to do a trade-by-trade analysis and see how swaps have been affecting your overall profitability.
–
At this point the performance analyzer (v0.1) contains all the same features as the EA analyzer indicator plus a bunch of improvements which make it a much more convenient tool for the analysis of a wide array of trading platforms. Now you only need one indicator loaded on your MT4 platform which only updates the database once each day and the Asirikuy Performance Analyzer can then kick in and help you do all your analysis. I definitely have a lot of plans for this tool with the inclusion of many additional statistics (such as the Ulcer and Pain indexes) as well as comparisons with daily performance for the S&P 500 and daily, weekly, monthly and yearly performance charts. Definitely having all this analysis outside of MT4 makes it a lot more powerful giving us the ability to go a lot deeper into the analysis of our trading platforms. The existence of the absolute database files also makes interactions with our profit and draw down analysis tool a real possibility :o)
This new analysis tool will be released this weekend to all Asirikuy members. If you would like to learn more about my work in automated trading and how we analyze systems based on Monte Carlo simulations please consider joining Asirikuy.com, a website filled with educational videos, trading systems, development and a sound, honest and transparent approach towards automated trading in general . I hope you enjoyed this article ! :o)


Daniel,
Cheers on additional achievement!
Is it worth to display ‘Type’ description instead of 0/1?
Maxim