Last week I mentioned the creation of a new Asirikuy system called Amachay which was developed thanks to the help of an Asirikuy member’s idea. Now that the system has gone through the appropriate code review, stability test procedures and adequate testing protocols it is now ready to go into a live-testing trading stage. On today’s post I will be discussing what this trading system attempts to achieve and why it is such a great compliment to our current Asirikuy systems. Within the next few paragraphs I will talk about the Amachay portfolio, the results it achieves on different currency pairs and what statistical characteristics might be expected from this EA on its first test run. Amachay will be Watukushay No.9 and will be released within the next few weeks to the Asirikuy community along with live accounts which will start to test its real market performance.
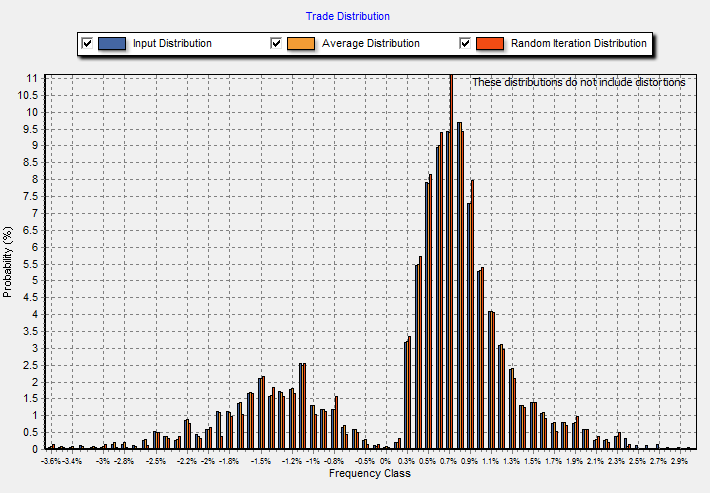
As I said on the first post about this EA, Amachay is a trading system based on the idea of capturing counter-trending movements based on Fibonacci retracements. The EA looks for price to be within certain Fibonacci levels defined at a predetermined time each week and then enters two trades if the conditions are appropriate. Amachay then uses two separate Fibonacci targets and a move-to-breakeven trailing stop to ensure the second position doesn’t end up at a loss once the first one is closed. As I have mentioned before this rarely works on most trading systems but in the case of this Fibonacci based system the move-to-breakeven has better results than simply aiming for fixed stop loss and profit targets with no additional exit or trailing stop criteria (by the way, a traditional trailing stop does not work better). Note however that the SL is moved to slightly above BE on trailing, reason why you get a small “spike” on the distribution of returns on the 0.1-0.3% classes.
–
–
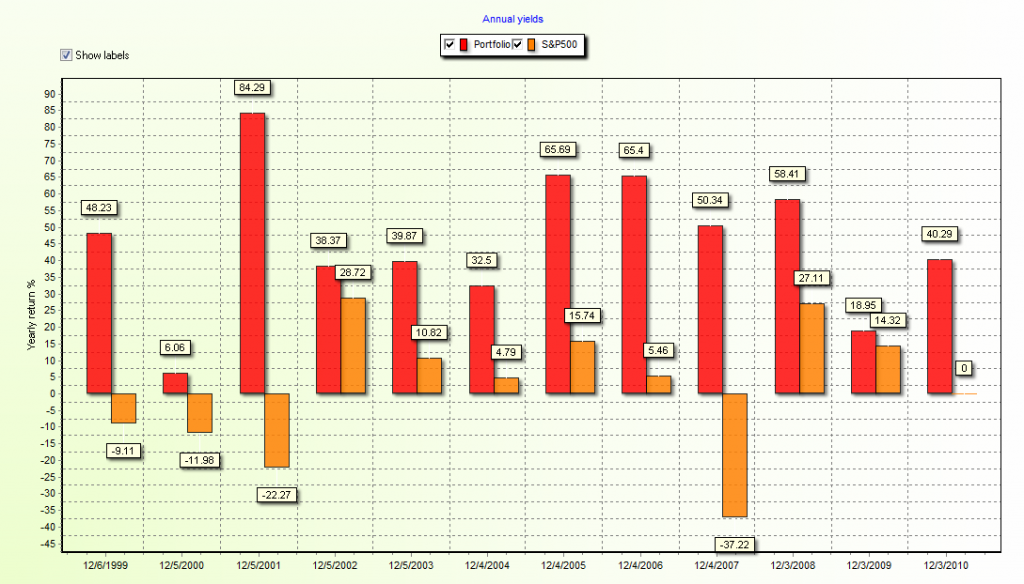
Through the past few weeks I have been doing a lot of development on Amachay and found a suitable optimization path that led to profitable outcomes on at least 6 different currency pairs with 2 years of out-of-sample testing. The out-of-sample test was only used once through the development process (on the last run) in order to ensure that it didn’t become in-sample testing data. The system was evaluated from 2000 to May 2011 using our internal Asirikuy Alpari UK 1-minute reliable data which was obtained DIRECTLY from this broker (it is NOT the data downloaded from the platforms). Amachay has therefore achieved a 6 currency trading portfolio which makes it a great addition to our Asirikuy trading system arsenal.
The Amachay portfolio achieves pretty good results which resemble those of many other Asirikuy single-EA portfolio setups. The EA achieves an average compounded yearly profit to maximum draw down ratio between 2 and 3, which makes its profit and draw down targets quite positive. The results are overall positive and similar for all the pairs tested although those pairs yielding a JPY components seemed to have more success. The EUR/JPY and USD/JPY instances seem to be the most successful and currently I am carrying out the development process on the GBP/JPY and CHF/JPY to see if we’ll be able to obtain an 8 currency portfolio which will probably increase our expected profit targets significantly (while reducing the draw down if the new pair results are not very correlated with the current ones). It is worth noting that – although initial results for the EUR/USD and USD/CHF weren’t very encouraging – the development procedure finally led to satisfactory results on these pairs.
–
–
Amachay also has an overall unfavorable reward to risk ratio of 0.53 because the move-to-breakeven strategy employed makes many trades just break-even while losses do generate a double stoploss. In the end this means that the strategy needs to achieve more successful trades to succeed as a significant portion of trades simply does not achieve profit but ends up at BE. The winning percentage of the strategy is 75% pointing out to the fact that the strategy depends on a significant accuracy which is derived from its Fibonacci levels. It is also worth mentioning that although the risk to reward ratio is unfavorable overall the actual per trade TP to SL ratio is in the order of 1:1 (meaning that the final targets on an individual trade basis are not significantly skewed).
The overall portfolio also has more than 2000+ trades so it has enough statistical significance for its expected profit and draw down targets to be considered statistically relevant. Monte Carlo simulations (100K iterations) derived from the portfolio simulations also show worst case values in line with what would be expected with a Monte Carlo average compounded yearly profit to absolute worst case ratio of 1.15 (quite good amongst Asirikuy portfolios). The distribution of returns is also quite interesting with two asymmetric peaks with the first one centered around losing territory and the second one (the larger one) centered around positive outcomes.
As you can see Amachay has generated a quite good portfolio which we will be testing live starting in a few weeks within the Asirikuy community. Amachay is our second counter-trending Asirikuy strategy which will become part of our diversification arsenal together with Sapaq, Sumaq and Sunqu. Certainly it will be extremely interesting to match Amachay instances with other Asirikuy experts but this will be the topic of a future blog post. If you would like to learn more about my work in automated trading and how you to can learn to run adequate portfolio and Monte Carlo simulations please consider joining Asirikuy.com, a website filled with educational videos, trading systems, development and a sound, honest and transparent approach towards automated trading in general . I hope you enjoyed this article ! :o)


