What is the optimum set of parameter values for a trading strategy? The answer seems to be a no-brainer, the optimal set of parameter values is assumed to be the parameter values with which the strategy has been able to perform with the highest performance under past market conditions. However this vision about the optimal parameter values of a strategy is very simple and naive since it assumes something which is simply not true (that past optimal values will be future optimal values under the same definition). Through this post I will share with you some of my finding regarding what we should define as an “optimum” and why the above concept of what is “best” actually leads to inferior results in the long term. After reading this post you will probably get a refreshed view of system optimization and why true optimization is simply a much more complex process than what most think.
When we build a trading strategy we always have some sets of parameters which can be changed. The question of which set of values is best is therefore very important as these values will determine the behavior of our trading strategy going forward. The easiest way to determine what might be “good values” is to perform extensive historical testing with many parameter values in order to find the best combination in the past and then validate this result in an out-of-sample test to ensure that we haven’t curve-fitted the strategy (making it very prone to collapse as soon as it enters live trading). However there is a big problem with this process, we’re assuming that the “best” in the past will be the “best” in the future.
–
–
After analyzing the above problem in a deeper way we come to an inevitable conclusion: the true optimum parameter set of any strategy is NOT the set of values which gave the best values in the past but it is the parameter set which gives the best values going forward. The problem of this view is of course that there is no way for us to know the future and therefore it becomes problematic to know with any degree of certainty which parameters will give the best results going forward. However after analyzing many strategies there are several phenomena which appear to be universal rules to the selection of trading parameters, showing us that certain behavior inevitably leads to future sub-optimal results.
The first thing I wanted to explore when looking into this problem was if the idea of choosing the “best” from an optimization over past values did give the best performance going forward. As a matter of fact results show – almost unanimously amongst all systems – that the best values in optimizations are NOT the best values going forward. Although the use of the best parameter values from an optimization does seem to preserve future profitability in most cases (when the optimization period is at least 10 years and simulations are ACCURATE), in the future this parameter set will almost never be the optimal. The market seems to “punish” those who are greedy in assuming that the best selection of parameters will be the same as the best choice in the past pointing out that there might be better ways to get the optimum parameters for trading systems.
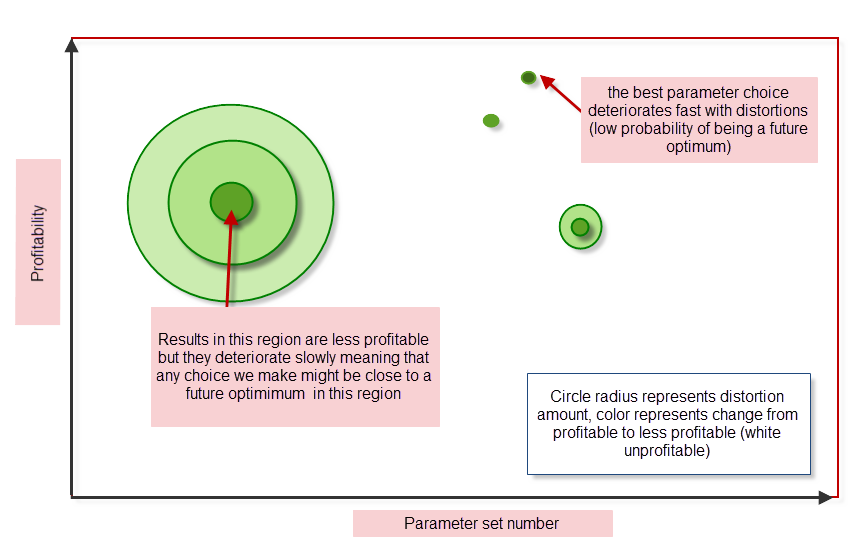
Looking at trading system optimizations from a probabilistic perspective it becomes evident why the optimum in the past is rarely the optimum in the future. If you think about system parameters as a probability space where each parameter selection determines a particular future profit and only one of them will be the future optimum then the chance of any past optimum matching a future one is slim and becomes smaller as the degrees of freedom (the complexity of the parameter space) becomes larger. However this view also points to the fact that whenever there is a region in the “parameter choice space” that has homogeneous past profitability going forward the probability of this region containing the optimum will be higher as results cover a wider probability.
My studies in this area have shown that when we choose the parameters of a trading strategy the best choice might not be to choose the parameter set that gave the best past performance but to map the probability space and choose regions which have homogeneous past performance. When choosing the best past performing parameter set we generally choose a “statistical anomaly” a parameter set which was incredibly profitable in the past but which may change significantly going forward and the danger of doing this becomes higher and higher when the complexity of the parameter selection increases. Mapping the optimization space is therefore very important as we are not only interested in a given parameter but in the profits generated by wide distortions around it.
–
–
With the above view we could conclude that parameter choices also follow a robustness Vs expected profit paradigm. When you choose the best past performing parameters irrespective of their surrounding region you are inevitably aiming for higher future expected profits with a lower probability of achieving them while when you choose a non-optimal past result which has a large group of similar neighbors you are sacrificing the idea of achieving higher profits in the future for an increased probability of achieving profitable results. In the end which parameter sets you choose depends highly on the compromise you want to achieve between expected profitability and robustness but what seems to be the wisest choice – as pointed by Aristotle long ago – is to choose the middle ground between both approaches.
In my experience and experiments the best way to optimize a trading strategy to preserve both expected profitability and robustness seems to be to choose a minimum “distortion survival ground” and to choose the best parameter set which can survive this test. For example you might decide that you want any result you use to survive 20% distortions of all parameters with a drop in the average compounded yearly profit to maximum draw down ratio of less than 30% and from all the results which achieve this feat you will choose whichever gives you the highest profitability. Right now this optimization process is quite complex – and cannot be easily carried out in MT4/5 (except when the number of parameters is very small) – but as our trading and evaluation tools evolve in Asirikuy we will be able to achieve very complex optimizations (my experiments have in fact been done on a prototype FreePascal tester I coded for this). Constructing a map like the example shown above is – from what I have experienced – the BEST way to perform true optimizations that choose parameters that might be future optimums.
In conclusion the traditional approach to optimization – running a large group of parameter sets and choosing the best one – is a “caveman” approach to the finding of optimum parameters which rarely pays off in the achievement of optimal results (the best performing) in future live trading. For a true achievement of parameter values which have a large amount of robustness and a high probability of being “future optimums” a careful evaluation of the parameter space is required to know not only the past profit of parameters but how well they survive complex distortions. Of course if you would like to learn more about my work in automated trading please consider joining Asirikuy.com, a website filled with educational videos, trading systems, development and a sound, honest and transparent approach towards automated trading in general . I hope you enjoyed this article ! :o)


Great article Daniel. I have been experimenting with distortion survival as well. It is often referred to as “sensitivity testing” in the modelling literature. One detail I would like to point out is that the optimal regions are often very asymmetric which means they tend to be composed of large areas of modest profit which are fairly robust and other areas of higher profit next to a cliff which falls to very low profit. Curtis Faith mentions this phenomenon is his book “Way of the Turtle” too.
Keep up the great blog.
Peter.
I like your ideas Daniel, I did something similar a few weeks ago I did 10 genetic optimizations, exported all 100 000 results to excel, and removed all the “over performing” and “under performing” results. The most “common” pair of settings was then used.
A mechanical auto procedure to do all this would be amazing, can’t wait for the Asirikuy Tester :)
Hello Daniel,
thank you for your another great article :-) I have ponder about the idea of profit/robustness for some months. I like the idea that a robustness of the trading system is connected with insensitivity to changing system parameters, it would be nice to create some index of robustness, I mean in the future, with the fast and good testing tool :-)
Best Regards,
Tomas
Daniel,
I assume the result can be shown in a 3D chart something like a topography map. Is that in the cards? (Since a picture worth 1000 words or in this case numbers)
Cheers, Mihaly
Hey,
I’m not sure how a 3D chart will be done with many set of settings consisting of 5+ variables, but what might work is to first categorize the set of settings, for example start with a random set of settings, include all settings within an X percentage deviation in that category, eliminate the chosen settings from the pool, and give them a category number. Then proceed until the pool of settings are depleted.
Now you have sets of category settings, where you can easily calculate statistics such as balance standard deviation or whatever for each category, that will work nicely for 2d and 3d graphs.
Hope the above made sense :)
I like your post! keep it up!