It is truly remarkable that there are almost no libraries for the calculation of financial time series statistics in python. Despite the existence of libraries like pyfolio there is actually no functional equivalent to an R library like PerformanceAnalytics in the python programming language, something rather surprising considering that the Python community is one of the largest programmer communities in the world (besides the Java community which is also huge). Due to this issue we have decided – together with my programming partner Jorge Ferrando – to create a library for the calculation of financial time series statistics which is set to imitate and improve on the functionality of the PerformanceAnalytics R package for the python community. On today’s post I am going to be talking about this library, which we have decided to call qq-pat.
–
import pandas as pd
from pandas_datareader import data
import datetime
import qqpat

aapl = data.get_data_yahoo('AAPL',
                                 start=datetime.datetime(2000, 10, 1),
                                 end=datetime.datetime(2015, 1, 1))

spy = data.get_data_yahoo('SPY',
                                 start=datetime.datetime(2000, 10, 1),
                                 end=datetime.datetime(2015, 1, 1))

ibm = data.get_data_yahoo('IBM',
                                 start=datetime.datetime(2000, 10, 1),
                                 end=datetime.datetime(2015, 1, 1))

data = pd.concat([aapl['Adj Close'], spy['Adj Close'], ibm['Adj Close']], axis=1)

analyzer = qqpat.Analizer(data, column_type='price')

analyzer.plot_analysis_returns()
analyzer.plot_analysis_rolling()
analyzer.plot_monthly_returns_heatmap()
analyzer.plot_annual_returns()
analyzer.plot_monthly_returns()
analyzer.plot_annual_returns()
analyzer.plot_monthly_return_distribution()
–
So what is the difference between this library and pyfolio and why did I deem necessary to make a new library if pyfolio already does a good amount of financial time series analysis? Despite the great work of the people at quantopian with pyfolio the philosophy behind their library is a bit different from what I consider a general library for time series analysis. My first objection to pyfolio is its current lack of support for any generic pandas dataframe or time series, for example if you load data into a pandas dataframe from a csv you will not be able to use it in pyfolio until you time localize it to UTC, a rather unnecessary requirement if you want to say just get the CAGR for your data. Another issue is that pyfolio seems to have been thought to analyse the results of a single return series. In my view a very important part of a time series analysis library is to be able to take in as many columns as the user wants and perform an analysis that puts these all together into the same place because most of the time we want to compare performance. Another minor thing is the manner in which they display performance, that strays significantly from what a library like PerformanceAnalytics does. Their library is also strongly focused towards stock trading system analysis – because that’s quantopian’s business – while I envision something much more generic, like PerformanceAnalytics.
With all that in mind we decided to start a project where we can generate all the statistics we want: the qq-pat library. The idea is to make as little demands as possible on the inputs (no time localization necessary, any pandas series/dataframe with balances/prices/returns will do), tolerate inputs with as many columns as the user wants and easily output graphs and statistics that users can either use in their own programs or in the construction of their own reports. The above test program shows a good sample of all the plots that are currently available within the program using a group of three stocks. You can however load your MT4 reports into pandas and also obtain an analysis for your Forex trading systems using the library. The qq-pat library is already available within pip so you can install it with the simple command “pip install qqpat”.
–
–
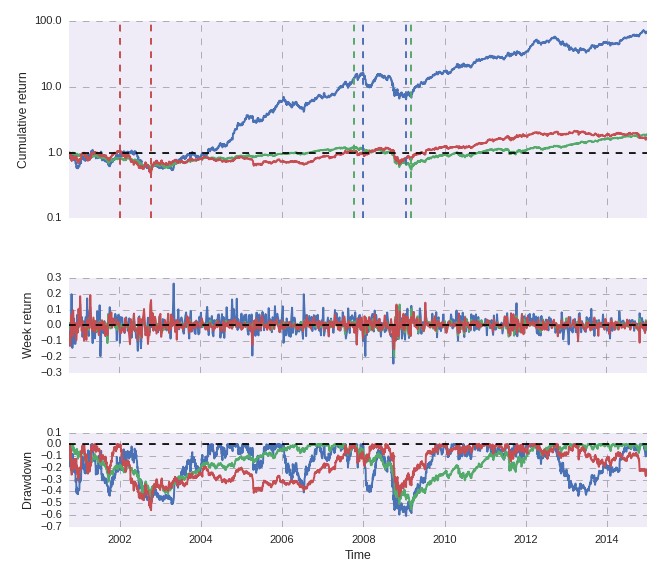
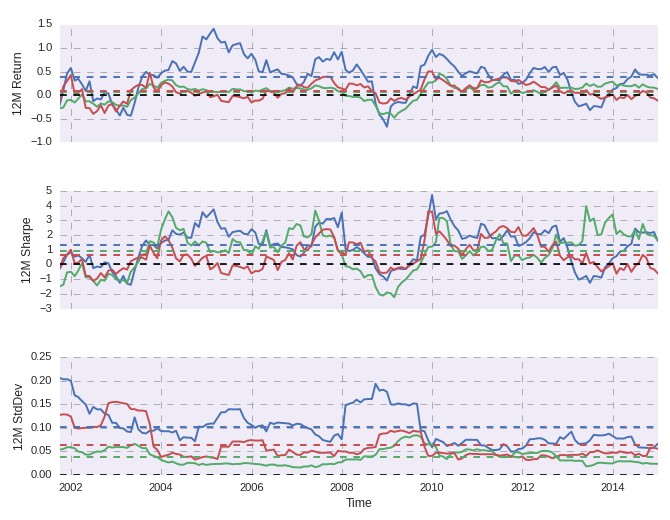
Two of the graphs that I like the most from qq-pat imitate two graphs that can be created using PerformanceAnalystics in R (the graphs I use the most from this library). These two graphs are the performance summary and rolling performance charts which contain vital summary information about the financial time series you are evaluating. The performance summary contains the cumulative return with a logarithmic y-axis, the weekly returns and the underwater equity plot (which is a good way to see all drawdown periods) while the rolling charts contain the rolling 12 month return, sharpe and standard deviation. As you can see above the two plots have both graphs aligned on the x-axis so it is actually very easy to get an instant snapshot of the return/drawdown/total return at any given point in time. We also added an improvement to the PerformanceAnalytics version which is the inclusion of two lines that mark the start and deepest point of the maximum drawdown period within the charts. As you can see you can also put as many pandas return columns as you want together and the library will plot them all on the same graphs.
–
–
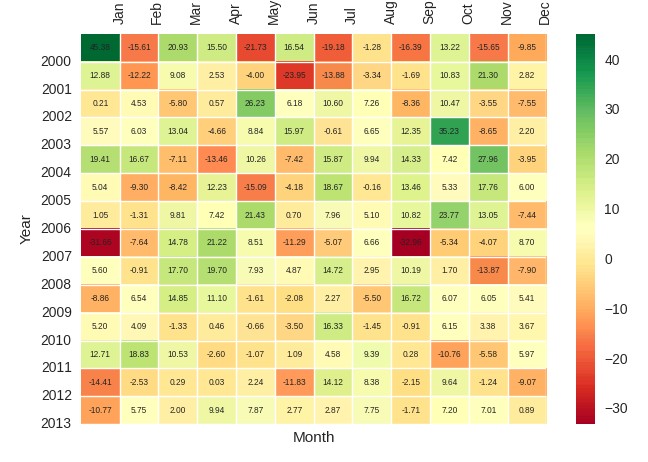
We also borrowed some good ideas from the pyfolio coders and created some plots that are very similar to those found within the pyfolio library (although we coded the implementations from zero to get exactly what we wanted). Above you can see the monthly returns plot from the qq-pat library which summarizes the month/year performance of the financial time series through time. We really liked the idea from pyfolio of using a heatmap to do this but we decided to also add a bar that shows the value for each color and also some minor changes to how the axis are displayed. In our case months are not displayed as integers (1, 2, 3, etc) but we actually display the month names within the upper part of the x-axis. We also rotated the labels on both axis in order to offer what we believe is a significantly better looking plot for the monthly returns.
–
     get_rolling_return(period)
     get_rolling_sharpe_ratio(period)
     get_rolling_standard_deviation(period)
     get_underwater_data()
     plot_monthly_returns_heatmap()
     plot_annual_returns()
     plot_monthly_returns()
     plot_monthly_return_distribution()
     plot_analysis_returns()
     plot_analysis_rolling()
     get_log_returns()
     get_returns_avg()
     get_returns_std()
     get_sharpe_ratio()
     get_downside_risk(, base_return=0.0)
     get_sortino_ratio(, base_return=0.0)
     get_max_dd()
     get_average_dd()
     get_cagr()
     get_annual_returns()
     get_monthly_returns()
     get_weekly_returns()
     get_pearson_correlation()
     get_mar_ratio()
–
Certainly we have yet to implement many statistics and plots we want and what we have currently only provided the very basic functionality that we consider useful for the online trading community. In the above list you can see all the functions that are currently implemented within qq-pat which should cover most of the basic statistics needed for useful time series analysis. We already have functions for calculating all the most popular risk adjusted return ratio (Sharpe, Sortino, MAR) as well as functions for the calculation of the maximum drawdown, average drawdown, cagr and monthly, weekly and annual returns. In time we seek to implement all functions that are within the PerformanceAnalytics library, which we hope will make this a very successful python library for the analysis of financial time series.
If you would like to learn more about how to code your own systems and analyze their trading results using powerful tools such as R and python please consider joining Asirikuy.com, a website filled with educational videos, trading systems, development and a sound, honest and transparent approach towards automated trading.


