The Hurst Exponent (HE) is a very popular statistic in financial time series analysis as it allows you to get an idea of how much a trading instrument trends or mean reverts compared to a random walk. However the statistic is often evaluated and compared with the value for a pure Gaussian random walk which may not be a right model for an efficient financial time series. Today we are going to look at the Hurst Exponent estimation for over 16 different Forex trading instruments and in particular we will compare the values obtained with those that are expected from completely efficient time series derived from the exact same distributions. After looking at this analysis we will be able to draw a picture of how useful the HE calculation really is and what conclusions we might be able to draw from the data.
–

–
The HE attempts to measure the fractality and long term memory of a time series. The statistic is useful because it carries with it a small number of assumptions and given large enough samples the results are usually not problematic. In addition the HE is bounded between 0 and 1 and analysts usually divide the regimes of series expected between those with an HE lower than 0.5, those with an HE around 0.5 and those with an HE above 0.5. If the HE is below 0.5 then the series is said to be anti-persistent while if the HE is above 0.5 the series is said to be persistent. In easier-to-grasp terms this means that series with an HE below 0.5 tend to mean revert while series with an HE above 0.5 tend to continue in their previous direction. A series with a value of around 0.5 is said to be neither persistent nor anti-persistent, a regular random walk.
However we know that the distribution of a financial time series does not match a regular Gaussian random walk so we shouldn’t expect a value of exactly 0.5 for efficient financial time series due to these distortions. In addition we know that the time series are not infinite and therefore – as with a random walk – we must calculate the distribution of potential HE values that we might obtain by chance for a given data length. This means that we should calculate the expected distribution of the HE for efficient series created using bootstrapping with replacement from the real data, which should generate series that do not have any inefficiencies present within them (since the returns have been shuffled). We can then use this distribution to compare it with the actual value of the HE for our series in order to really evaluate whether our HE measurement can tell us anything useful about the series in question.
–

–
Using daily data from 1986 to 2016 for 16 currency pair and doing 200 simulations over random data series created using each pair’s distribution of returns I was able to obtain the HE distributions you see above. In this image the red lines show the actual HE value for the real time series while the blue lines show the mean of the HE distribution obtained from the 200 random time series with the same distribution. As you can see the distribution in most cases goes from 0.45 to 0.65 meaning that all values between these two extremes are rather common cases for an efficient time series of this length. Repeating the exercise leads to the same results, meaning that the distributions calculated using random series have indeed converged to their expected values.
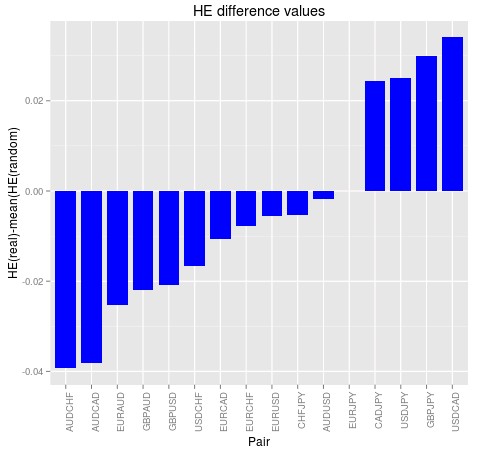
You can see at first glance that the HE values for the real series do not fall anywhere near where they should fall if we were to say that the HE did not come from an efficient series. In most cases to be able to negate the null hypothesis that the HE is the result of an efficient series with a 99% confidence we would require to have values above the 0.6 mark or below the 0.45 mark, which actually never happens within the Forex symbols you can see above. This implies that from the standpoint of the HE for the daily returns of these series the series are indeed indistinguishable from efficient symbols. The difference between the mean of the distribution an the real value – showed on the second image above – shows us that the pairs with the largest differences are the AUDCHF and the AUDCAD but even then the differences are still so small (just -0.04) that we cannot say with any sort of large confidence that there is a deviation from the scenarios expected from efficient series. We would need differences in the 0.1 mark to say with good certainty that the series is bound to contain some inefficiencies as analysed by the HE exponent.
–

–
The above exercise shows us how we could have made mistakes by simply looking at the financial time series and their deviation from the 0.5 HE value assumed for a gaussian random walk when in reality we should be looking for abnormal values relative to the actual expected results over efficient time series generated using bootstrapping with replacement. After performing the correct analysis we can see that the HE gives very little information as the amount of anti-persistance or persistance within the series is not large enough as to draw a clear distinction from efficient series using the HE exponent. Of course if you would like to learn more about time series analysis and how you too can learn to create systems to exploit historical inefficiencies within the real data please consider joining Asirikuy.com, a website filled with educational videos, trading systems, development and a sound, honest and transparent approach towards automated trading.strategies


I think it’s imperfect logic. For example if we will test skewness of S&P this way we do not get meaningful results. But positive skewness exists.
Positive skewness in the S&P does not mean that there are inefficiencies in the S&P it merely implies that it’s a biased random walk. An inefficiency is an ability to extract a profit beyond that which is expected from random chance. If the S&P is efficient it may still be profitably traded simply because it is biased (that’s why buy-and-hold strategies are expected to work on the SPY). The question is not whether you can extract profits or not but whether you can do so much more efficiently than what you would expect simply from chance. In positively biased symbols like the SPY the mean random expectation is actually to profit, this is because the index value increases as a consequence of real value creation in the underlying industries (this is what creates the bias in the random walk). Of course I am not saying that the SPY is or is not efficient I am just pointing out that a drift in a series does not constitute an inefficiency.
For the most part , I was not talking about S&P skewness :). Rather, I was talking about statistical testing. I think you have to test the hypothesis of equality of the expectations of True Hurst distribution with synthetic one and then we can talk about the significant.
Thanks for replying! I failed to understand the above, could you please explain what you mean by “test the hypothesis of equality of the expectations of True Hurst distribution with synthetic one”?
I fail to see faults in the statistical hypothesis testing within this article. You have a HE calculation and you want to see whether you can negate the null hypothesis that the value of the HE for the series is as expected for an efficient series with the same distribution. You create a distribution of expected HE values from series produced using bootstrapping with replacement and you find that the values for the real series falls completely within that distribution. You cannot negate the null hypothesis. Please feel free to point out where I might have gone wrong.
I’m talking about such test https://www.khanacademy.org/math/probability/statistics-inferential/hypothesis-testing-two-samples/v/hypothesis-test-for-difference-of-means. If your means are not equal then you can exploit Hurst exponent in your strategies. I hope in the next articles, you will write about how to exploit it and another properties of stochastic processes.
This only applies when your null hypothesis involves two distributions. The hypothesis test suggested on the blog post is a different case, where two distributions are not involved. I therefore fail to see how mean difference hypothesis testing would apply. Of course I might be wrong so feel free to explain in more detail how you would perform such a test if this is the case.
You may have problems in with collecting the whole distribution of real Hurst (because of not enough data or it can change over time), but I believe it’s right way to test such hypothesis.