You hear people talking about “market conditions” all the time. You will usually hear things like “this system only works under trending conditions” or “market conditions are really strange right now”, etc. But what is exactly a “market conditions”? Can we define this obscure concept in a way that is useful? Does it make any sense to develop things for “different market conditions”? Through today’s post we will look at what exactly is a market condition, how we can attempt to see their variation and why defining market conditions in qualitative terms is actually not very useful. We will take a true look at how market conditions have changed through time and through this we will be able to draw some conclusions about whether it is or is not worth it to develop systems to tackle different types of conditions.
–

–
The concept of “market condition” is assumed to be intuitive and is yet extremely elusive. Most traders will tell you that market conditions simply define the current state of the market bu they fail to define what the state of the market means or how it can be quantified. Traders who want to go further generally use some type of qualitative or very poorly quantitative measure to define what constitutes a market conditions form simply “the market is trending right now” to things like “the ADX is below 10”. These type of observations are not useful because they rely either on extremely flexible concepts – what a trend is for example – or fail to explain differences among seemingly equal conditions — for example the market does not behave the same way every time the ADX is below 10.
What is a market condition then? It is the current state of the market defined as the way in which the values of a series have related to preceding values during the recent past. Since when you trade you’re naturally interested in making predictions of the future the way in which the past has related to the future across recent data is relevant to you. Efficient series – non normally distributed random walks – may show sporadic trends and ranges reason why the fact that a series appears to be “trending” or “ranging” does not mean you could be able to extract profits from it, the actual nature of market conditions goes way beyond what a mere ADX or similar measurement might tell you. Any attempt to quantify current market conditions should therefore be able to establish a measurement that is unequivocally related to how values within a time series have related to each other and should be able to easily distinguish an inefficient period from an efficient one.
–

–
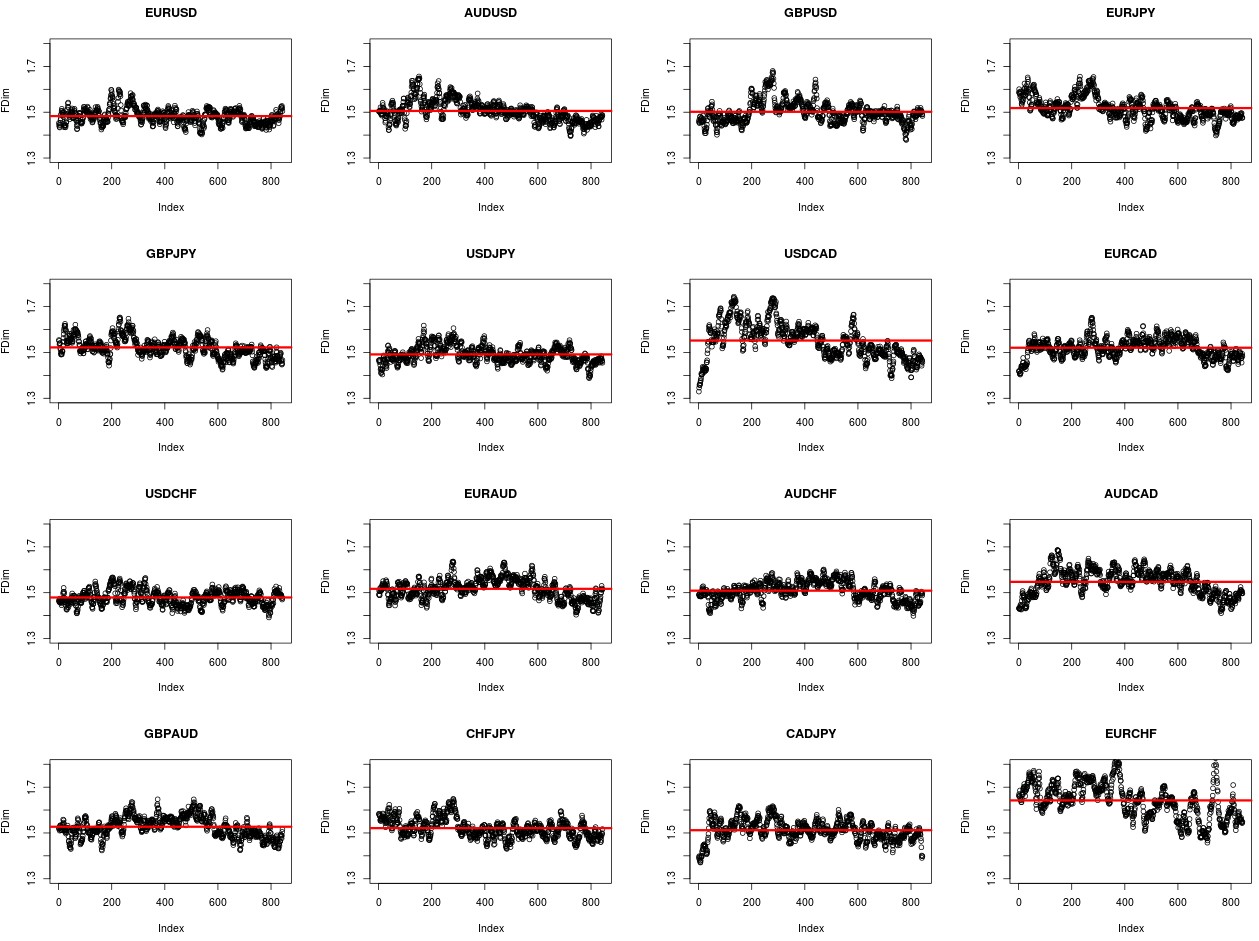
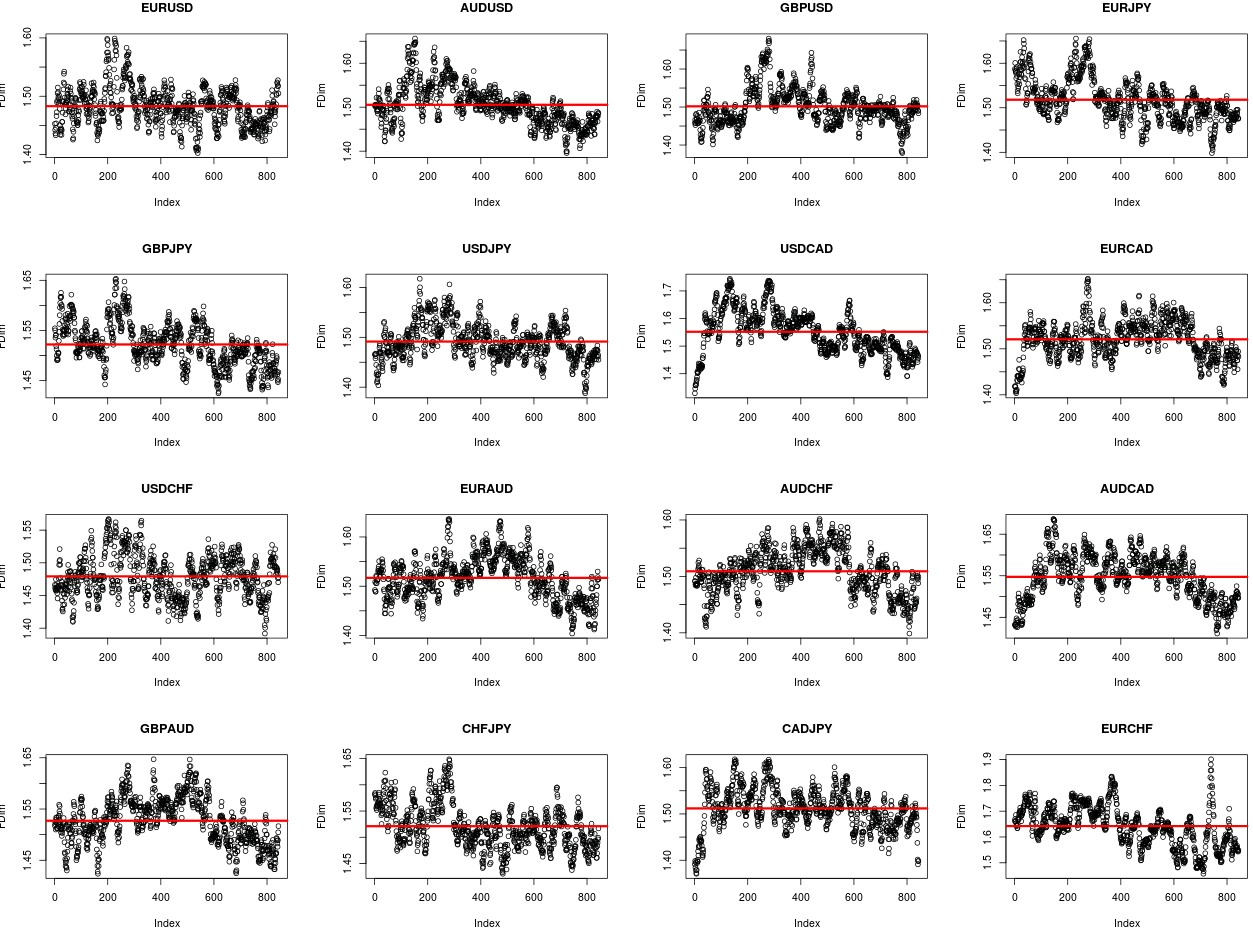
Using a property such as the fractal dimension is a good way to quantify market conditions because the fractal dimension is intimately related with whether a series is efficient or inefficient, its value changes substantially depending on whether there are or aren’t any relationships between past and future values within a time series. Looking at 2000 hour windows shifted by 100 hours across a period of 30 years for 16 different Forex symbols we obtain the charts showed above. I kept the range of the charts constant on the first image so that you can get an idea of how different the variations of market conditions have been for the different trading symbols while on the second chart I allowed the charts to auto-scale so that you can better see the variations within each symbol. The average values are showed as a red horizontal line.
It is easy to see from the above that market conditions have been anything but constant during the past 30 years and that some symbols have much stronger variations in market conditions than others. It is also evident that on some symbols market conditions that had never happened before happen while on other symbols market conditions tend to repeat as a function of time. Take for example the AUD/USD, the fractal dimension had rarely been below the 1.55 mark before – only in the 1980s – but currently the fractal dimension is at very low values. A very similar thing happens with the USD/CAD where the fractal dimension had only been very briefly below the 1.5 mark but now seems to remain there under recent market conditions. This explains why it’s so difficult to create profitable systems for these symbols, maybe they look as if they are trending/ranging but the exact way in which they are currently doing it – whatever the case – has only happened very rarely in the past and therefore a system that trades them is bound to take losses as its predictions had never been designed for such conditions. A good test for this methodology to measure market conditions was the EUR/CHF peg, as you can see when this was established the fractal dimension value immediately shot up to never-seen before values as these were in fact never-seen before conditions for this symbol.
–

–
The above also shows you why it does not make a lot of sense to develop systems for what traders generally call “different market conditions”, not every range and every trend are equal because the relationships between past and future values change and can change to types of relationships that a symbol had never seen before. You may have a system that you think can work on a “range” but perhaps the range you trained it to work on was a range that corresponded to another fractal dimension range – where relationships were different – and hence your system will fail. This also shows why success is so attainable on symbols like the USD/JPY or the EUR/USD where market conditions have remained within rather tight ranges that favor that systems designed to exploit the past may have a good chance to exploit the future. If you would like to learn more about automatically creating systems across more than 28 years of historical market data that can tackle a very wide variety of historical market conditions please consider joining Asirikuy.com, a website filled with educational videos, trading systems, development and a sound, honest and transparent approach towards automated trading.strategies


