The Sharpe ratio is one of the most widely used statistics in trading and investing. It is a good starting point to compare two trading or investment strategies and can help you assess which one has the best risk adjusted returns. However given the nature of the Sharpe ratio there are in reality many different ways to calculate it and which one you use can heavily affect your results and make the comparison between Sharpe ratio values completely meaningless. Today we are going to talk about how the Sharpe is calculated and what you must be careful with when comparing the Sharpe ratio of different financial time series.
–

–
The Sharpe ratio is normally calculated over a return series, it’s expressed as the mean average return over the standard deviation of returns of a financial time series. The problem comes when you realize that there is no standard “return series” in financial time series and therefore there are many potential return calculations, all which can lead to different Sharpe values. For example if a person uses daily returns and another uses monthly returns their average returns and standard deviation of returns will most likely be very different. Sometimes people even use the trade-by-trade return series, which cannot be used to properly calculate a Sharpe ratio as the Sharpe always needs to be calculated across a defined period return series.
To attempt to alleviate this problem people decided to introduce multipliers that would attempt to annualise the Sharpe ratio to put it in equal terms regardless of the return series used. To do this you divide the size of the year in business days by the size of your period in business days and then multiply the Sharpe by the square root of this number. In this sense if a Sharpe was calculated using a daily series it would be multiplied by the square root of 252 to convert it into an annualized Sharpe, a Sharpe calculated using weekly data would be multiplied by the square root of 12, etc. This solution makes all Sharpe values reach similar orders of magnitude but it still does not make them comparable.
–

–
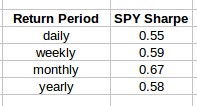
To exemplify how bad the problem can be take a look at daily, weekly and monthly annualized Sharpe values for the SPY showed in the table above. The annualized Sharpe value increases as you move to longer period return series and is completely different for each series. The yearly value – which does not have any multiplier – is 0.58 which is much smaller than the value calculate using monthly returns, which is 0.67. Although all of these values would be reported as annualized Sharpe ratios the truth is that they are all different and they are not compatible with one another. A Sharpe ratio calculated over daily returns will tend to always be smaller – because the standard deviation of the daily returns always tends to be larger – while the monthly Sharpe ratio will tend to be higher than the true yearly Sharpe ratio.
It is clear from this information that the Sharpe ratio is not always the same thing and therefore you must be very careful when comparing the Sharpe ratio of different investments. A tricky investment manager can show you a Sharpe ratio that has been annualized from monthly returns to inflate the statistic while another might perform the analysis over daily returns and come out far worse. You can easily make a mistake and choose a worse investment in terms of risk-adjusted returns if you are unaware of how the Sharpe was calculated and you’re using this as a criterion for strategy selection.
–

–
To avoid the above problem always make sure you calculate the Sharpe from a return series yourself. This will ensure that you know that all the Sharpe ratio values have been calculated in the same manner, which can save you some headaches when making comparisons. Other statistics can suffer from similar problems – everything that is calculated using the mean or standard deviation of a return series – so make sure you always calculate the statistics from equivalent return series rather than trusting some statistics given to you. If you would like to learn more about how to make this type of calculations please consider joining Asirikuy.com, a website filled with educational videos, trading systems, development and a sound, honest and transparent approach towards automated trading.strategies


