Traders often ask themselves about what the best way to detect trending movements is. Although there are many ways in which trends can be detected, having an idea of how recently a pair has reached a new high/low is a good way to know if momentum towards a given direction is constant or decreasing, giving you a very good idea about whether a trending movement has formed or is starting. Today – as a post forming part of the indicator series – I want to talk about an indicator that does just that, allowing you to have a very good idea about how price is pushing for new high or low values. This indicator – the Aroon oscillator – is generally used to determine trend strength/weakness but its uses can go far beyond that, giving useful information about the formation of consolidation regions and the start of new trends.
The Aroon oscillator was first created by Tushar Chande in the year 1995. The indicator is calculated in a very simple manner and attempts to relate current price with the highest/lowest price levels achieved within the past N period. The aroon oscillator is formed by two lines (Aroon up and Aroon down) with one line talking about highs and the other one talking about lows. The oscillator values are obtained by calculating the difference between how many bars ago the highest/lowest bar was reached and the period value used for the indicator. This value is then normalized by diving into the indicator period and multiplied by 100 to obtain a percentage value. So if you want to calculate the Aroon up indicator value on a period 80 and the highest high within the past 80 periods was reached 5 candles ago, the value of the oscillator would be (80-5)/80 x 100 which would be 93.75. As you can see, the more recent the highest/lowest values are, the higher the value of the Aroon oscillator. A value of 100 for the up oscillator means that the highest value of the past N periods matches the last candle while a value of 100 for the down oscillator means the same for the lowest value. It is worth noting that while other oscillators – like the Stochastic oscillator – relate price with the percentage it represents of the highest/lowest levels, the Aroon oscillator relates the time position of the highest/lowest points relative to current time. Salvador The Aroon oscillator gives information about “time-since” not about relative positioning of current price Vs trending milestones.
–
–
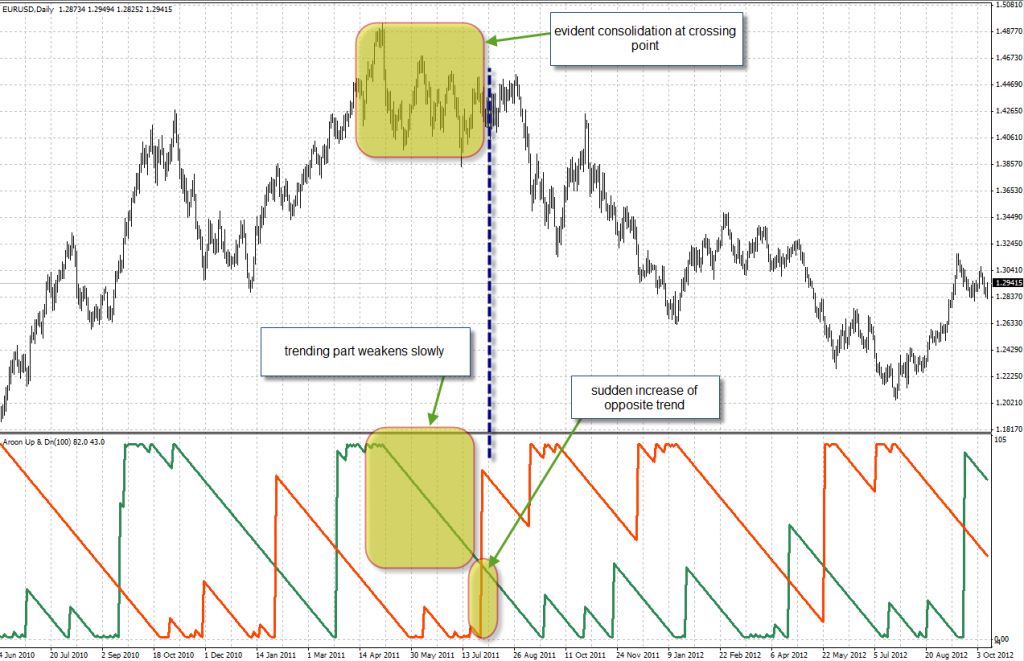
When you have a perfect trending movement the values of the Aroon oscillators will tend to be extreme (100-0 or 0-100) however when the trend starts to weaken you will start to see a convergence of the oscillators towards a median value. Nonetheless, a perfect convergence of both oscillators towards a cross in 50 generally doesn’t happen because often the strongly trending part will start to weaken far before the other part becomes important. When the trending movement weakens there will be a moment where the opposite trending movement will increase dramatically (breakout) which is when you have a consolidation and the possibility of a reversal. The values of the Aroon oscillator tell you at this point that the highest and lowest point within the past N periods are fairly equidistant, suggesting that there is no reason in the N period past to choose either direction.
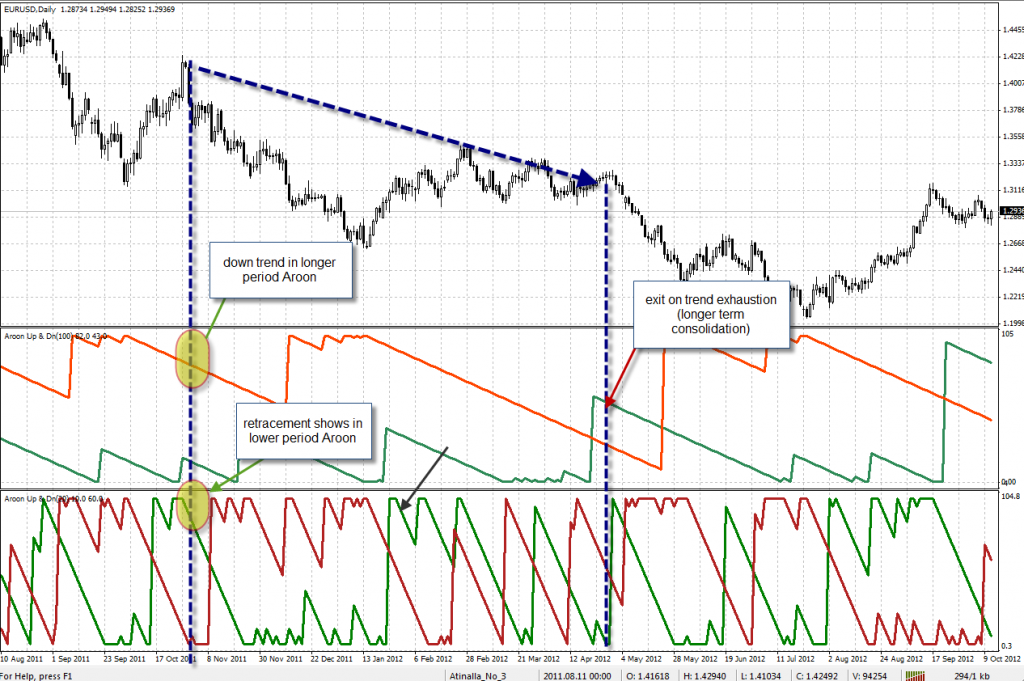
A good strategy is to look at the Aroon oscillators using different periods so that entry points might become more obvious. For example we can use 100 and 25 period Aroon oscillators to better gauge our entries in the market by entering a previous established trend once it weakens enough in the lower period to show a retracement. What this shows us is simply that the highest high/lowest low of a small number of periods is small while when counting a higher number of periods the value is very low. This divergence is characteristic of a shorter term retracement which is simply a short term opposite spike within a trending movement. After entering we can then run the trend until a long consolidation period appears in the longer term Aroon oscillator, forecasting that we need to exit as the possibility of a reversal is now very important.
–
–
As you can see the Aroon oscillator offers a very straightforward way to look at consolidation regions and the establishment of new trending milestones. Since it offers a very simple calculation to track the distance to the highest high and lowest low of the past N periods, we can use this information to derive trending characteristics across different period values. With this information it then becomes easier to enter, exit trends and judge consolidation period lengths and importance. The above could be used as a simple guide to build an algorithmic strategy using the Aroon oscillator, potentially exploiting the use of several Aroon oscillators to better tune trend entry and exits.
If you would like to learn more about how to understand and use indicator calculations in algorithmic trading strategies please consider joining Asirikuy.com, a website filled with educational videos, trading systems, development and a sound, honest and transparent approach towards automated trading in general . I hope you enjoyed this article ! :o)


