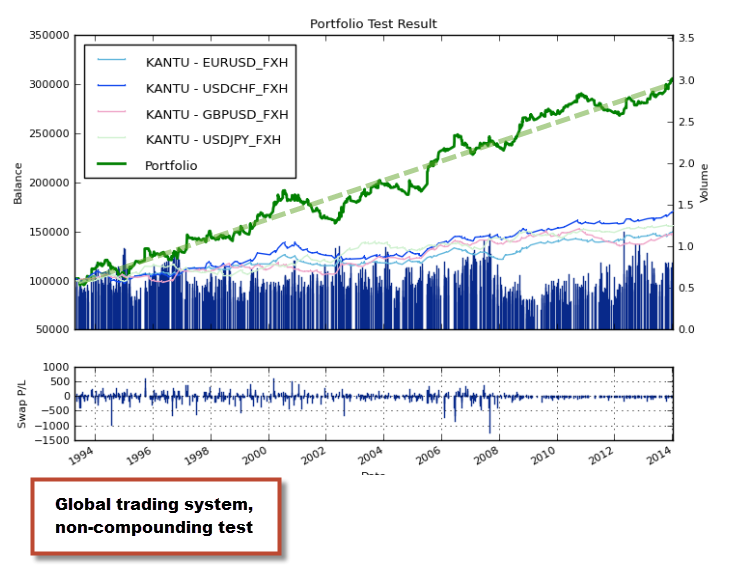
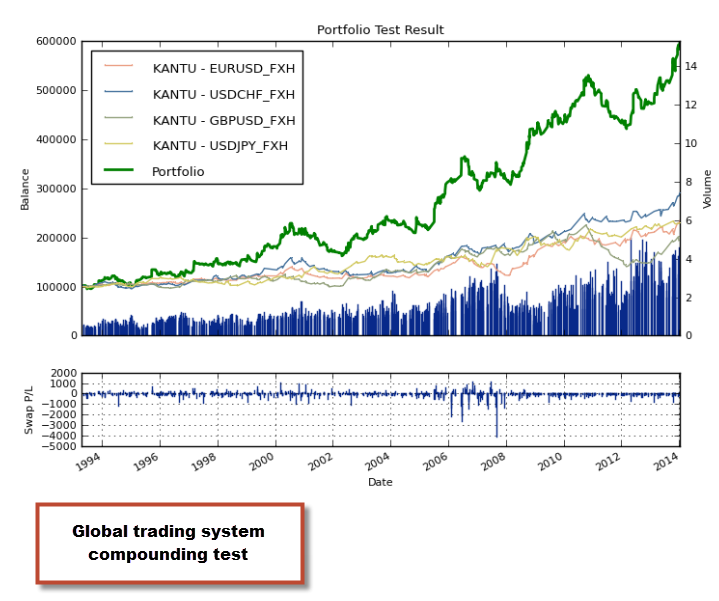
There is a good reason why people seek systems that can trade profitably across several instruments, primarily because this carries the idea of additional robustness (something I have debated across recent Currency Trader Magazine articles). However, finding systems that work well on different instruments is difficult, because such a system needs to be able to work across conditions that are often dramatically different. For example if you want to build a system that works on the EUR/USD and the USD/JPY your strategy needs to give signals that have a statistical edge on both pairs, meaning that the daily volatility cycles (which correlate with market opening/closing times) as well as other factors such as the overall volatility of the pairs, their particular kurtosis, etc need to be irrelevant or properly accounted for by the strategy being used. On today’s post I want to share with you a simple system that achieves the goal of 20 year profitability on the 4 Forex majors, the EUR/USD, GBP/USD, USD/JPY and USD/CHF. Through the following paragraphs we are going to discuss the system’s logic as well as its qualities, defects and potential problems.
–
–
Finding systems across multiple pairs is a really tedious task – when done manually – and often the only widely known published systems that work (sort of) across the board are trend following systems (donchian breakout channels and the like), which profit from long term trends that can last years (although these systems haven’t been very successful during the past ten years, particularly regarding drawdown lengths). However thanks to data mining techniques – using Kantu – we can find some signal set that works across the four majors, in addition we can specify the filters and criteria used to find the strategies such that the signals generated fit exactly what we want to get.
Obviously there are pitfalls to this approach – read data-dredging – although this is minimized by the large data set (4 symbols) and the long analysis period (20 years). I also performed a test attempting to try to find a similar system using random variables (purely spurious correlations) and found no system after more than 1 billion system building attempts. The probability of this system being the result of data dredging is low, although not zero. Note that this doesn’t mean that the system cannot fail going forward, obviously buy modafinil in south africa past performance never guarantees future results (even if the correlation has a true causal relationship in the past, it doesn’t mean that this cannot change in the future as market conditions change).
–
–
Back to the trading strategy. The trading system I want to share with you today is very simple, using a combination of 3 price action based rules on the 1D charts. The logic for longs and shorts is as follows (note the system has no parameters at all, except for a simple stop-loss):
–
Go long (close short)

Close[9] > Close[10]
Open[158] > Low[130]
Close[156] > Close[173]

Go Short (close long)

Close[9] < Close[10]
Open[158] < High[130]
Close[156] < Close[173]
–
Note that the system reverses trades on opposite signals so if a system is within a long and it receives a short signal it will close the long and go short. Another important factor is that the system uses a 180% of the 20-ATR stop-loss which is updated whenever a signal in the same direction is received (for those of you with the doubt, adding new positions on new signals in the same direction increases draw downs significantly, much more than it does profits). Another important aspect – if you want to reproduce my tests – is that my data is refactored within the F4 framework to be GMT +1/+2, the refactoring also makes all Monday candles start at 4 and all Friday candles end at 19 (GMT +1/+2 time). http://busingers.ca/wp-json/wp/v2/pages/\"http:\/\/busingers.ca\/concerts\/frostiana\/\" This re-factoring and timestamp is absolutely critical as without it the relationship between your candles will change. Thankfully the F4 framework performs all of these changes automatically for us (this is one of the main reasons why a strong professional programming framework is so important in FX trading).
–
–
The system has some decent results within the past 20 years with 4 unprofitable years and 16 profitable ones. The strategy has also performed quite strongly under recent market conditions while its weakest results were in 2011, 2001 and 1994. The system has a reward to risk ratio of 1.68 and a winning percentage of 45% with a profit factor of 1.38. The maximum drawdown period length for the 20 year period is also quite large at 1137 days (in 2001) with a second close happening in 2011 (above 1000 days). The non-compounding graphs for the strategy are also quite decent with a linear R^2 coefficient of 0.97, not as highly linear as other single-symbol systems we’ve seen in the past on the blog. Profit to drawdown characteristics for this strategy are relatively similar to a stock buy-and-hold, with an average compounding yearly profit to maximum drawdown ratio of 0.33 and a total return of 482% during the 20 year test.
Another thing worth mentioning is that the strategy has a quite strong overall Mathematical Expectancy (ME = MFE-MAE) which is also positive and similar for all the different symbols traded. The mathematical expectancy is overall smaller for short trades, increasing up to 18 bars after trade open and then decaying up to about 80 bars after open when the trade ME for shorts becomes negative. The ME for longs has an overall much longer life with values increasing rapidly up to bar 30 and then slowly continuing up to bar 74. However this favorable movement after bar 30 is more likely the effect of some temporary fundamental bias towards the upside on several pairs through the test, our systems seeks to capture the trades within the first 30 bars, something evident by its average trade duration of 24 days.
–
–
A very interesting aspect of this system is also its overall lack of correlation with equities, the best years for this system are in fact aligned for the worst years for equities and vice versa, this shows some of the value that FX trading has for larger investors, where systems like this (with similar performance to the stock buy-and-hold) can benefit an overall portfolio by making sure that overall weak correlations favor overall portfolio positive performance. Although I wouldn’t trade this system as a retail FX investor without a lot of additional improvement (because of its poor AAR/MaxDD characteristics), systems of this type could well be used for the balancing of an overall larger portfolio including equities and bonds.
If you liked the above post and you would also like to build/test/use systems based on data-mining approaches that can be developed to seek any desired characteristics please consider joining Asirikuy.com, a website filled with educational videos, trading systems, development and a sound, honest and transparent approach towards automated trading in general . I hope you enjoyed this article ! :o)


Hi Daniel,
You wrote: “note the system has no parameters at all, except for a simple stop-loss”
I think this is false. The system has 6 parameters, the close periods [n]. These parameters were selected by the data-mining process. It does not matter that you have 4 pairs because the long history almost guarantees that you will find something that will work even with a low win rate and low CAR/DD. But I wonder why you do not show out-of-sample results. I would expect that you design the system in 75% of the history and then do an out of sample in the remaining 25%. Regardless of that it is not correct to say this system has no parameters because you did not set those at random but the choice was the result of data-mining. If this is the best Kantu can do then it may not worth the time spent. Thanks.
Hi Bob,
Thanks for your comment :o) The system was mined on 1993-2003 data, 2003 to 2013 is out-of-sample. I am sorry if I forgot to mention this (for future reference, this is my usual practice). I also don’t think this is “the best Kantu can do”, it’s just part of what it can achieve. If you want to get to know the software a bit better there is a demo version where you can download the software and run any tests you want to get an idea of what it can and cannot do. Obviously if you have any ideas to improve the software after you try it do let me know :o) Thanks again for posting,
Best Regards,
Daniel
hi Daniel; I agree with Bob; the system has actually 8 parameters; the ones mentioned by Bob plus Stop Loss of 180% plus ATR period of 20.
hi Daniel, another comment I have is I see that most of your systems that you published in these blogs are based on daily timeframe.
I personally do not trade daily timeframes in FX; I only focus on intraday; 1h and below.
This is because we don’t have a long life to wait to see if a system is going to work. I mean no one is going to trade a system that has 4 losing years. I suggest you focus on hourly data or less.
Hi Alpha,
Thanks for your post :o) We do develop systems for the 1H time frame (most actually) at Asirikuy. Thanks again for your comment!
Best Regards,
Daniel