Software tools that allow for automatic trading system generation are not holy grail creators. Their power to automatically generate wide arrays of strategies searching for a given historical result gives them an overwhelming propensity to fall into the traps of curve-fitting bias and especially data-mining bias (DMB). It is not a coincidence that most people who use commercially or freely available tools that perform this task – such as strategyquant, adaptrade or openKantu – fail to realize significant real live trading gains from their system creation efforts. In reality the successful use of data mining for the creation of trading strategies involves the measurement or at least estimation of the data-mining bias component and the minimization of curve fitting bias. Of course such measurements are computationally very expensive and are not within the computational capacity of most retail traders, neither are they included in most of these software packages. Today we are going to learn how we can create a portfolio that attempts to minimize these sources of bias trying to avoid the computationally expensive steps that would be required to truly measure DMB.
–
–
Before continuing I would suggest you read some of the posts I have written about DMB (1, 2, 3, 4). In general the DMB for a system searching process increases when you use less data and when you increase the complexity of your mining process. The larger your mining space and the less data you use the more likely you are to find systems that have a high probability of being caused by spurious relationships in your historical data. Generally if you are going to perform searches on little data (for example just a few years of market data) or using a high level of complexity (for example if you’re searching 10 billion potential systems) it is absolutely fundamental to create some estimation of DMB because it is very likely that a large amount of the time you will have a high chance of your systems coming from spurious relationships. If you cannot create this estimation then you have to both decrease the complexity of your searching process and greatly increase the amount of data you will use. This is still no guarantee that you won’t be using high DMB strategies (the best way is to estimate DMB), but at least you minimize your chances to fall into this trap.
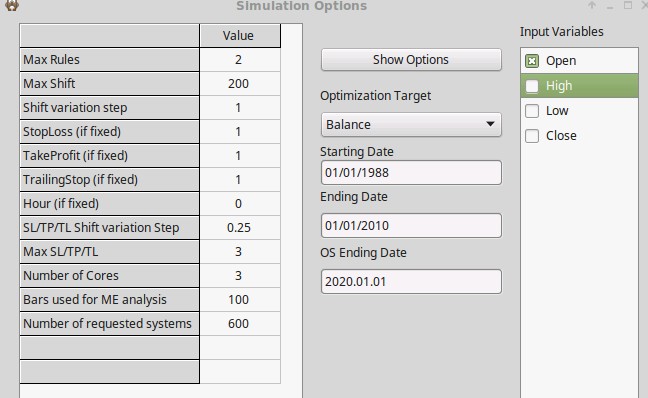
We are now going to use OpenKantu to perform a mining exercise where we expect DMB and curve-fitting bias to in fact be low. In order to do this we will be performing a system search over 8 Forex symbols over 23 years of daily data (1986-2010, period A) for systems that use 2 rules with a max shift of 200, a shift variation step of 1, a max SL value of 3.0 and an SL step of 0.25. We are also going to be using only Open values to build the price patterns to make the space small. All these options are shown in OpenKantu on the first picture in this post. For filters we are going to be using a minimum number of 10 Trades/Year and a minimum R² value of 0.7. These filters ensure that we find things that have a significant trading frequency a somewhat evident correlation between time and returns. To perform this searching process I have used the Find Systems->”Multiple symbols” option to search for systems that pass the filters on all the input data-sets. Formally measuring the DMB of the entire space using pKantu’s GPU technology – as OpenKantu does not allow for this – has given me a probability to come from spurious relationships below 1% for all strategies, meaning that the process indeed has a low DMB.
–
–
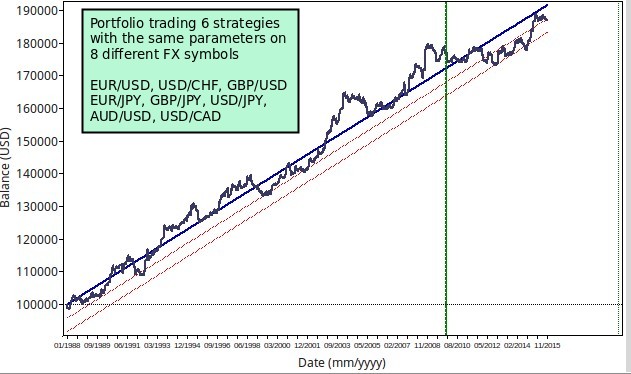
The 2010-2015 time span (period B) was not included in the generation step but is used in the final test. Note that this is not an out of sample test due to the fact that no historical out of sample testing is possible (read this post to learn why). This is merely a period not included in generation for which no attempts at curve-fitting were made. Over a search of 100,000 systems using OpenKantu I was able to find 6 systems which give the results shown above. The final portfolio has quite decent linearity (R²=0.97) with much better statistics than the separate systems traded along the different symbols. The results in period B continue to follow the central regression line found in period A, pointing to the fact that the portfolio performs in a similar manner outside of the region used for mining. The portfolio has a maximum drawdown length of 1868 days, a winning percentage of 41.86% and a reward to risk ratio of 1.39.
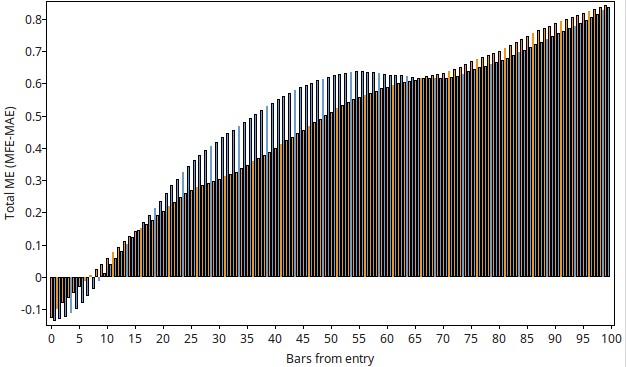
It is also interesting to note how mathematical expectancy behaves for the different individual systems on the different currency pairs, overall we find very favorable behavior of MFE-MAE for all systems on most symbols with the general curves looking like the examples shown above (yellow bars for shorts, blue bars for longs). We generally see an increase in the MFE-MAE value as a function of time, pointing to a trend following character of the generated price action based systems. This means that our systems are exploiting trends on most of these FX symbols.
–

–
It is worth noting that the above exercise does not give the same results when using less data (for example using only 10 years of data) so it is quite important to use a lot of trading data (possibly +15 years) in order to be able to obtain similar results. Note also that it is not the amount of bars that matters but the amount of information required to construct the bars. To build 25 years of daily bars you need 25 years of tick data while the same amount of 1 min bars contains a lot less tick data information. For this reason this exercise requires more than 15 years of data, regardless of the timeframe you intend to use. Using this large amount of symbols is also required to reduce the DMB to acceptable levels on the daily timeframe since the use of less symbols implies using less data which directly increases the likelihood of a system coming out of random chance.
The above exercise provides a hopefully illustrative exercise on how strategies with low DMB and reduced curve fitting can be built using a tool as OpenKantu. Due to the lack of mechanisms to measure DMB in this software it is very important to take strong measures to attempt to reduce these values as much as possible. Using low complexity search spaces as well as large amounts of EOD data and a long list of symbols helps generate strategies that capture “market wide” inefficiencies that have a higher chance of standing the test of time.
Of course much better strategies can be built searching much more complex and larger spaces using much more powerful computational tools. If you would like to know how we do mining using GPU technology at Asirikuy using our pKantu software and how we measure DMB through our cloud mining effort please consider joining Asirikuy.com, a website filled with educational videos, trading systems, development and a sound, honest and transparent approach towards automated trading.


