Generating trading systems through automatic means is nothing new. There are several algorithmic implementations available commercially, usually involving different methodologies such as genetic algorithms, random pattern searches, etc. However every automatic search for a trading strategy suffers from a significant problem derived from the notion of data mining bias, which is related with confusing a strategy that exploits a real historical inefficiency with a strategy that is simply a consequence of random chance. The more intensive the search, the worse your data-mining bias will become, meaning that you will have a greater chance of finding something “better” simply because you looked for it harder. This is a simple consequence of expanding your search space because the law of large numbers dictates that even highly unlikely scenarios will be drawn as the sample size taken from a distribution grows. On today’s post I am going to describe a way to systematically evaluate data mining bias (DMB) to determine whether a given performer from a given system search is likely to be the result of random chance or a true historical inefficiency. We are going to look at possible sources of additional bias and we are going to describe a methodology that does not depend on complexity, selection or past experience.
Let us suppose you want to search a given financial instrument for profitable historical trading systems. The first thing you need to do is to define how you will search for systems (what systems interest you) and this system filter choice must avoid selection bias. For example if you’re developing systems for symbol A and you know that for A systems with high risk to reward ratios have historically performed better, including such a filter using this statistic introduces a selection bias (influence of past experience). Any performance filter must be based on symbol-independent criteria which can equally be apply to any financial instrument. Since we know what the ideal trading system looks like (a non-compounding system is ideally a straight line) we can make the non-biased assumption that we want to search for something as close to ideal as possible (highly linear systems). In addition we can also search for only systems that have traded with a minimum frequency (trades/unit of time), because we cannot evaluate linearity accurately on systems that have lower frequency.
Now that we know what type of systems we want to generate we must now choose a performance metric to evaluate our systems. This performance metric must be based on some characteristic we want to maximize for our strategies, for example we can use the profit, the sharpe ratio, the profit to maximum drawdown ratio, etc. You can also perform the analysis for various performance metrics if you wish. The idea of the performance metric is to allow us to score the systems created so that we can establish a method to rank our strategies.
–
–
From the above let us suppose we want to find systems that are highly linear (R2>0.95), which have a trading frequency above 10 trades per year, which have been profitable during their last trading year and we will use the profit to drawdown ratio as a performance metric (all criteria that can be applied to systems on any trading symbol). We now need to define a search space where we will be looking for these strategies, however the methodology needs to be established such that the definition of this space does not affect your conclusions. As with the filtering criteria, your search space needs to be generic, it cannot be specific to the symbol you’re developing for. This means that the search space usually needs to be somewhat broad and include no previous knowledge about the symbol you’re trying to evaluate. For this example I will be using a space composed of 2 price action rules with a maximum shift of 30 and a stop-loss ranging from 0.5 to 3.0 of the daily ATR for the symbol being tested. For the symbol selection I chose a Forex pair randomly from a set of 25 historical files, to ensure that my example has no bias from my past experience with a few FX pairs.
But how do we evaluate whether our created trading systems have any merit? This is where things get a bit more complicated. You cannot tell if your systems have or don’t have any merit simply by looking at their performance because you don’t know the probability that such a performance was generated randomly. How high or low your performance metrics can get will depend on the complexity of your system search space, so you cannot evaluate your strategy just by looking at how “good or bad” it looks. In order to evaluate whether a trading strategy can be due to random chance you need to define a benchmark to compare it with, which must be from a system generation procedure where profitability from random chance is the only possibility.
In order to do this we take the price series we’re using and we generate N new random series generated from it. In order to do this we use a bootstrapping technique with replacement in order to preserve the distribution characteristics of the instrument. After doing this we then search for systems (using our above established criteria) on all these random series and we generate a distribution of all the systems that we found according to your chosen performance metric. Note that the value of N needs to be large enough so that the empirical cumulative distribution function of the statistic’s population converges, if it does not converge then your sample is not large enough to make any valid assumptions. In my experience an N between 50-100 is usually enough as to get an empirical cumulative distribution function that varies less than 0.00001% between iterations. You must also exhaust your whole search space on all the random series (search for all possible systems), so that you have no bias relative to how much of the available space you are evaluating. Note that this post’s results were repeated with N > 500 and results remained exactly the same after the ECDF converged (as mentioned above).
–
–
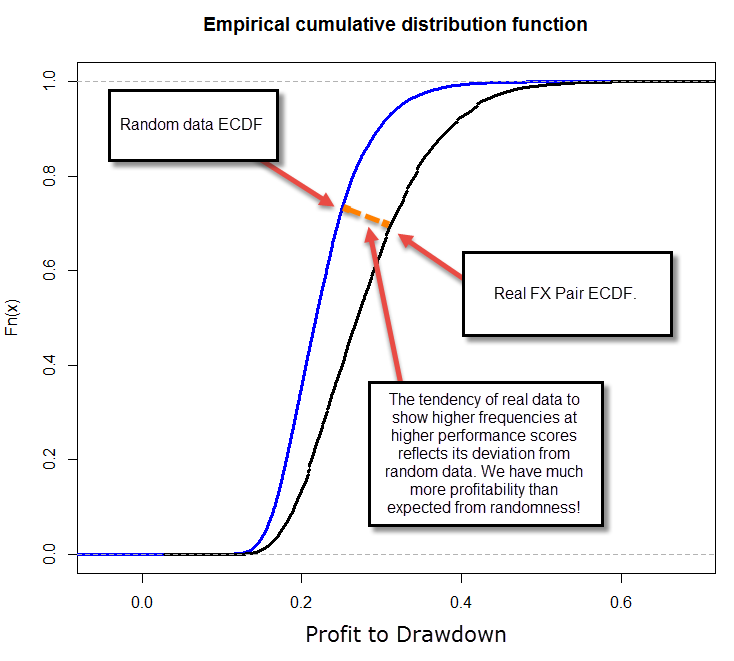
After we have obtained the empirical cumulative distribution function for our random strategies we now know how many random systems are expected to be generated for a given number of tests. We can get this value from any class within our distribution by simply looking at the total number of systems (B) and the frequency of that class. If we have 500 systems in the 0.2-0.3 class within a 5,000 system distribution then we can say that the probability to have drawn a randomly profitable system with a performance value of 0.2-0.3 is 0.1 or 10%. With this information we are now ready to generate systems using our real data.
After generating a distribution of systems obtained from the real data we can now calculate exactly what the probability of a system belonging to random chance actually is. Since we know the probability that a system with a given performance metric will exist out of random chance, the probability that our systems belong to random chance can be summarized as C/X, where C is the probability of the strategy to be generated from random chance according to our previous tests and X is the probability of the strategy being generated within our real data. Think about it this way, our real data contains both randomly profitable and non-randomly profitable systems (at best) and therefore the probability that a system is randomly profitable is simply the extent to which the random data generation probability covers the actual real generation probability within our system. If you know that in random data you have a 20% probability to generate systems with a 0.2 performance score and you get a 20% of these systems on your real data, then you cannot say if your systems are or aren’t due to random chance, because you got exactly the amount you expected from the random distribution. If you had obtained 40% then you could say that 50% of your systems are expected to be profitable due to random chance (20/40), so the probability of your systems to come out of random chance is 50%. If a system has a zero frequency in random chance, then the probability to generate it is at least lower than 1/TS where TS is the total number of system generation runs attempted across all searches on random series. This is another reason why we need to look into many different random series, because otherwise TS would be very small and we would have large random chance probabilities for systems with low frequencies on our real data.
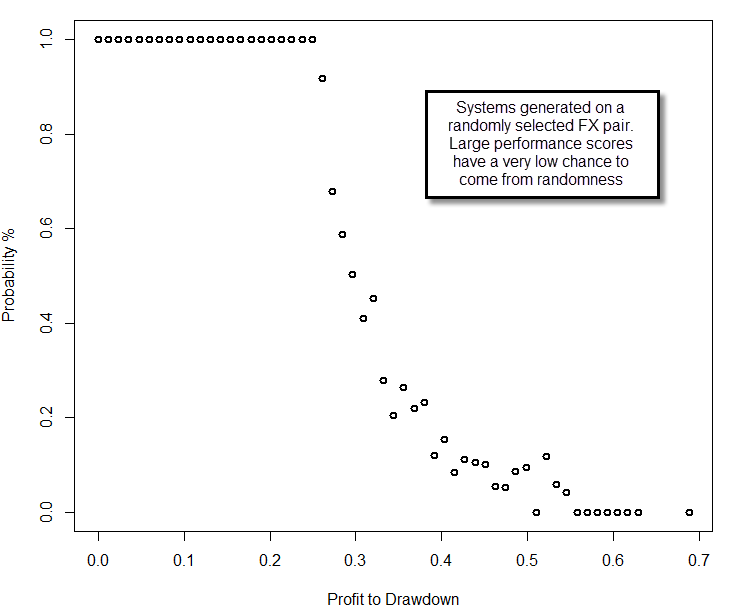
You can then generate a plot with the probability of your systems to come out of random chance (above), which gives you the confidence with which you can assume that the system comes from random chance. You can see in the above example that for systems with a performance metric above 0.6, the probability that they come from random chance is minimal (less than 1 in 60 million for this particular test). This shows unequivocally that price action based generated strategies – at least in this example – are most likely NOT the result of random chance, at least for a set of more than 200 top performers. Note how the probability that the system belongs to random chance increases as we move to lower values, because it is simply not possible to distinguish in this case between both worlds as we generate a lower or equal mount of systems as expected from random chance probabilities. The empirical cumulative distribution functions also reveal the fundamental difference between systems on random and real data (we will talk about Kolmogorov-Smirnov and other tests on future posts). The methodology does not rely on past experience, uses data from all systems generated and accounts for the probability of random system generation, generating a clear confidence interval for the expectation of a strategy being the result of random chance.
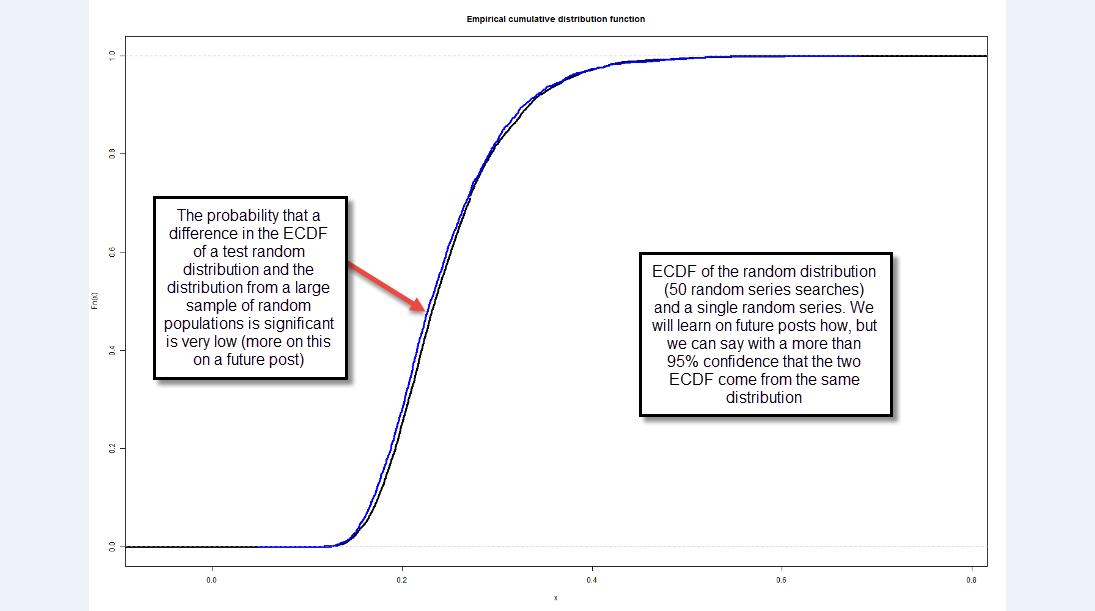
The above methodology is also robust to changes in complexity, because the methodology includes an incorporation of all the trading systems generated, without any selection bias. If you increase the trading complexity you might increase your system profitability and your DMB which will in turn lead to a different empirical cumulative distribution function on your random and real data that will lead to similar conclusions in the end. This method therefore cannot be fooled by a selection bias related with system complexity because the whole method adapts to the level of system generation complexity being chosen. I have tested several wider and smaller complexity regions, always reaching similar conclusions. You can also test the above method using random data as if it was “real data” (second image above) and you will get in the end a result that accurately predicts that the probability that your systems are random is always incredibly high.
There are also some other useful metrics that you can use to determine how much your real data distribution differs from the distribution of the random chance systems, something that we will be discussing on future posts. Note that the above conclusion – – that we can generate systems that aren’t expected to come from random chance – cannot be taken generally and the test must be repeated for any symbol that you want to test. Symbols with a heavy long term bias might show much higher probabilities of good profitability on random chance. If you would like to learn more about algorithmic system creation and how you too can generate your own trading strategies please consider joining Asirikuy.com, a website filled with educational videos, trading systems, development and a sound, honest and transparent approach towards automated trading in general . I hope you enjoyed this article ! :o)


Daniel,
I think you should have someone proofread your articles if possible ( I know that’s difficult) before you publish them because they seem to be written in a hurry. Look at this sentence for example:
“Think about it this way, our real data contains both randomly profitable and none randomly profitable systems ”
Do you mean the following?
“Think about it this way, our real data contains both randomly profitable and non-randomly profitable systems”
I hope you realize these sentences have totally different meaning and while reading you article I got very confused. I hope you also realize that I read your articles word by word because they are interesting.
As a general remark that casts doubts on your results:
Low probability of random system according to your method DOES not preclude a curve-fitted system. Any well fitted system will pass your tests, i.e. your test does not prove that your data-mining method does not fit the best systems to the data.
Meaning that you are back to square 1.
Dear Daniel,
Thank you for this post, although I agree with Bob about some proof-reading.
Let me tell you that I strongly (wonderfully) appreciate your deep interest, now, for a topic that I was “friendly fighting” with you within Asirikuy already last summer, if I remember correctly. Good that also now you see how important it is.
Let me anyway warn you about a small but important difference. I feel you are mixing up data dredging with mining bias here (and bob points out also overfitting, that is another “subset” of the problem, I think).
Data dredging (closer to overfitting) means that, by using mining algorithms, you come out modelling noise instead of signal, if you want, or random (normal? perhaps not) errors instead of variables. Massaging data enough, your historical data series, which is just a sample out of the population of possible outcomes it could have taken in the past (read: which it could take in the future), you will surely find out some function for fitting it. But, if this is not the signal, but instead the noise, that you have extracted from the population, even with the linearity constraint, you have nothing that is useful for the future.
Mining bias comes from the fact that, by imposing an objective function (profitability, etc…), and given that each function estimated from an experimental sample will have an error attached, you come out selecting every time the ones that, by (model+error) result better than the others, where the differential can exactly be the modeling error more than the function. I have not fully understood in you example above whether this is the case in your experiment, because you seem to consider “all” the systems generated by a Kantu run, without excluding any one. But when it comes to choosing one strategy to be traded, there you will surely pick one showing a result which contains also the mining bias component.
The big question to me, and I am still going around for finding an answer, is whether such bootstrapping randomization is correct when it goes about analyzing time series (like financial data), which often are characterized by the precise sequence of data (financial markets aren’t autocorrelated, at least at a certain extent?). Therefore it could be no surprise that your systems generated on “real” (unscrambled) time series would look much better than bootstrapped. After all, all these mining efforts would extract at least a part of the “edge” present in a financial historic series as they are, right?
What I would prefer is to see some benchmark comparison, to show that the mining-generated system produces a result which is statistically different from the benchmark. And for obviating the lack of a lot of validation sets, an alternative, in my view, could be the generation of a huge number of runs of random trades with the same characteristics (besides the forecast of a “direction of the move”, i.e. buy and sell) as the modeled ones, on the intact data series.
Just my two cents. I have no answers, but just some cautious doubt.
All the best!
Hey Bob,
Why don’t you cut Daniel some slack? Or start your own blog where you share so much valuable information for free as he does, but without typos?
I’m pretty sure the amount of work Daniel puts into writing just one article goes beyond 2 hours easily. Constructive criticism is good. Yours isn’t. You dedicate 70% of your comment to criticize. But still you come here to digest all he writes. C’mon. This is not the Wall Street journal with hundreds of editors and reviews of anything that goes out.
I’ve read your comments in other articles. You really love criticizing Daniel’s work and sometimes in a harsh way.
I’m with you on this.
I think it’s great that someone can critique someone’s work and provide constructive feedback but I don’t see Bob doing this.
Bob if you have the answers by all means share them on this forum or with Daniel personally. I’m not telling you to stop debating Daniels work but how about providing some substance and solutions.
Alex, I was the one who offer the suggestion to Daniel about testing on random data. So keep quite.
Daniel can stand criticism because he knows. You cannot stand criticism Daniel can stand. This is because you have no idea of the severity of the issues.
It does not matter what kind of work Daniel has done, his work is a victim of something simpler than DMB, data fitting.
I was going to offer an idea of the next stage but I have decided that the audience does not really worth it.
Good luck to all of you. If you actually trade you will need it. You will so happy to never hear from this criticizing Bob again.
“I was the one who offer the suggestion to Daniel about testing on random data”
Shouldn’t you have said?
“I was the one who offerED the suggestion to Daniel about testing on random data”
There you have it. A typing mistake. And your comments were much smaller than any one of Daniel’s articles. I hope you get my point.
You have completed missed the point Bob. You are happy to give out criticism on someone’s grammar or spelling skills(I might add to someone whose first language isn’t English) but can’t take it yourself and threaten to take your bat and ball and go home. No one has told you to stop providing comments but maybe do so in a less.arrogant way….anyway it’s your call.
Good points Fabio. I also think there is a more serious confusion here based on what you pointed out. Daniel has actually proved that his data-mining method has the potential of delivering some significant system. But that significant system we do not know which one it is or if it has even been created actually. The best performer would be a fitted one most probably. The best system is some place in between the best and worse performer but we do not know how to get it simply because it always changes according to market conditions. Yes, (P)Kantu has the potential of finding a system but we do not know which one it is. Simple as that. This is the problem of system development. Daniel is going in circles around this problem at the center.
Hallo Bob,
I am not sure whether I can completely agree with you about the “always changing market conditions”. They might be so, but, as you correctly point out, taking it to the extreme makes the search of “systems” simply “meaningless”. As soon as one of those “comes out of the lab” (into live trading) it would be obsolete. And an open question to me is whether you can guarantee the non-randomness of markets (whose deviation from a Markov chain or a pure – eventually drifted – random walk can be demonstrated) can be guaranteed in a regime of randomly changing (i.e.: every time new and unpredictable) deviations from randomness (= “inefficiency”).
I am still studying this subject. Aronson has a good set of pages in which he questions the hypothesis of “continuously changing market conditions”, showing that in several cases this is simply the conclusion of disappointed “system developers” who did not statistically demonstrated (at a sufficient degree) that the performance measures of their nice-looking-but-finally-failing system deviate significantly from a null baseline/hypothesis. I appreciate Daniel’s efforts in this direction.
He also promised to explain more in future posts, and cites 95% confidence intervals. So: I will follow up with curiosity.
Aronson is not convincing at all especially when he publishes a book that can be digested in 5 pages of a blog dozens of pages deal with simple first order logic examples. I got the impressions he was more of trying to convince himself than anything else. His concepts are fundamentally flawed anyway.
95% confidence is not enough. The remaining 5% can make you broke. This is not measuring of people heights or sampling for bad wine bottles. Sometimes I wonder if some people that write books have ever traded.
Anyway, since some people are offended, overlooking my contributions hare, I quite, I delete the link to this blog and I move ahead. They will remain behind, I am sure about this.
Bye
Hallo Bob,
if ever you’re still reading.
I am a bit sorry for the way things evolved here, but also quite surprised for your reaction.
Of course I haven’t just Aronson on my radars, don’t worry, I just “cited” him because many people know that material and can then understand better what I was summarizing in a sentence. I think that the idea of hypothesis testing is a serious one, and you cannot just dismiss it because it was written (taken from blogs, or simply, from a bit of statistical education) by Aronson.
The 95% confidence interval of course refers to hypothesis testing in systems evaluation, not to trading results, and therefore I am quite surprised that a well informed and educated person like you comes out with so inappropriate comments.
But, after all, we just chat here while we are making our good deal of research by ourselves. Good luck to you! Surely, as Daniel does, you have a wealth of good stuff in your own drawer.
Hi Daniel
I am not pointing out your spelling mistake or typo. But I just want to understand these sentence below.
“In addition we can also search for only systems that have traded with a minimum frequency (trades/unit of time), because we cannot evaluate linearity accurately on systems that have lower frequency.”
Looking at your last part of sentence. Are you actually suggesting that choosing high frequency system is better to evaluate linearity accurately than lower frequency system.
Also in your first figure, you have plotted fn(x) against Profit/drawdown.
What is fn(x) here? I assume it is frequency. Am I right on this?
Please help me Daniel. I only want to understand your article more accurately.
Kind regards.
[…] the data-mining of daily price action based systems across different Forex symbols. Please read my previous articles on data-mining bias before reading […]
[…] distribution of generated systems converge and you have got yourself a way to know your DMB (see this article for a more detailed […]