This year my greatest concern has been to establish a proper methodology for the systematic generation and replacement of trading systems that are deemed appropriate for live trading. From a formal perspective, this means that we want to be able to create systems that have good historical performance statistics plus a very high certainty (at least lower than 1%) that they come from a real historical inefficiency. This means that we want systems for which the obtained statistical results cannot be explained by the random chance to obtain these results simply due to the system creation process (the data mining process). The data mining bias (DMB) measurement gives us this precise value and allows us to know the probability that a certain search process generates a certain scoring statistic within a certain logic search space. Today I want to show you some of the results we have obtained by using cloud-mining within Asirikuy as well as discuss some of the consequences that this has for the way in which we will be orienting our system building efforts.
A key aspect when building a trading system is to figure out if the results correspond to a real historical inefficiency or are simply a consequence of the effort put into the system’s generation. Mainly you want to know how easy it would be to get the same result by performing the same search on an instrument for which you know there are no possible real historical inefficiencies. In practice this means that you need to carry out an exactly identical system search on random data that is of equal distribution to your real data (for which I use bootstrapping with replacement) and see if you’re able to get a system like the one you got on your real data. Repeat this process until the distribution of generated systems converge and you have got yourself a way to know your DMB (see this article for a more detailed explanation).
–
–
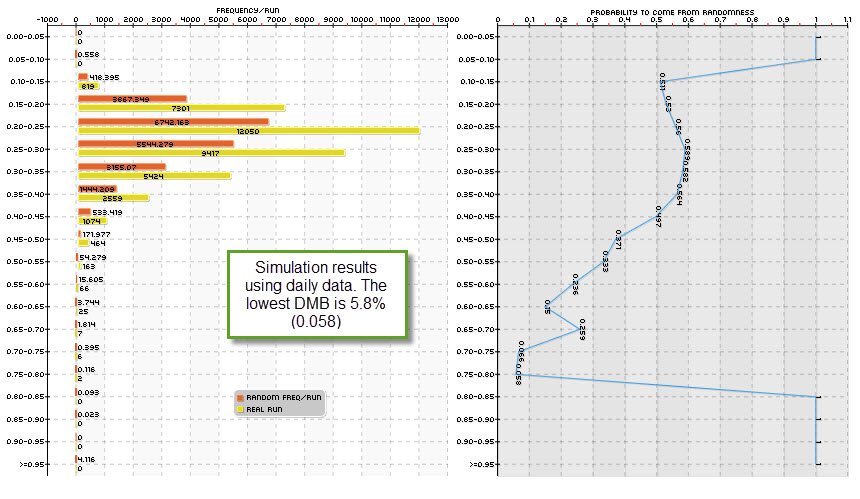
With a clear methodology to know DMB the problem now becomes to generate systems that have a low DMB and can therefore be trusted within live trading. Originally you don’t know what has a high or low DMB – you don’t know the probability that something may or may not come out within random series – so you must try several different system generation schemes to find something for which the probability to be found across random data is extremely low. The first and easiest thing to try is the generation of systems on the daily timeframe, where the computational effort for moderate to large spaces is low (just a few minutes or hours cover millions to billions of systems when using pKantu and modern GPUs).
Our results show that the daily timeframe is mostly not suitable for the generation of trading systems because attaining low DMB values is very hard. In the graphs shown within this article the distributions are made according to the Average yearly profit to Maximum drawdown ratio for the systems, which we use as a scoring metric. For the EUR/USD only a few system generation methods yield low DMB values and these are not even low enough to be considered acceptable for live trading (the lowest probability we have obtained for a top performing class of systems is in the order of 2%, but most commonly these values are in the 5-30% range). For other symbols the DMB is even higher and therefore these systems are not suitable for live trading. Even if their statistical characteristics are extremely good, the probability that these come from the search process alone is very high. This is especially true for symbols that have strong long term trends within their history (think USD/JPY), because simply trading randomly in one direction more than the other is enough to be profitable.
I also think that a large past of this has to do with the lack of cycles within the daily time frame candles. Since there are no such things as market open/closing bars and no clear volatility cycling, the random data tends to look very similar to the real data. Although you can still see serial auto-correlation for volatility in real data – which do not exist in random data – these are far less strong as the ones in the hourly time-frame. This also matches the observation that statistical tests for randomness tend to almost unanimously say that the daily time frames follow a sort of random walk with a high probability. This is telling us that the if there is anything happening there, it will be very hard to distinguish it from something that is just there due to randomness.
–
–
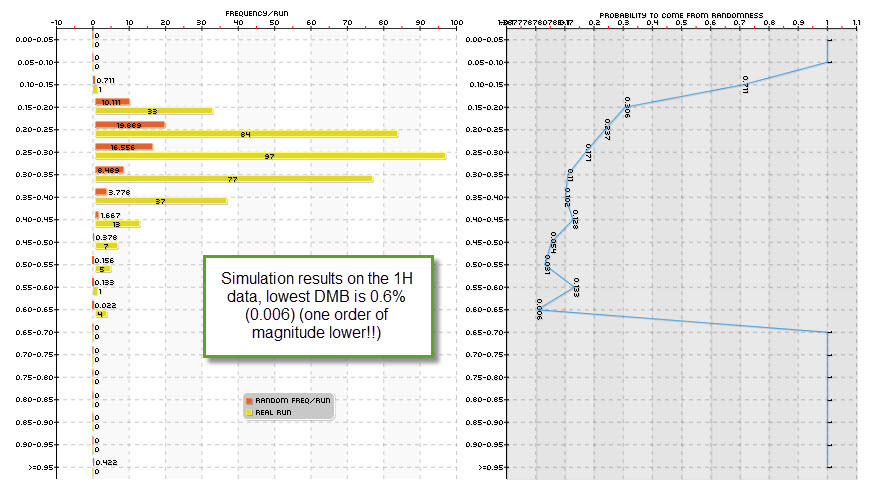
Having looked at the daily timeframe I then decided to take a peak at the hourly timeframes which is a 24x more time consuming task that demanded the use of our cloud-based mining effort at Asirikuy (something that has been going great!). It turns out that DMB in the one hour time frame is about an order of magnitude lower than in the daily timeframe in most cases. This matches both the decrease in the probability to come from a random walk given by statistical hypothesis tests and the suspicion that the volatility cycles available across the lower timeframes are somewhat beneficial to the finding of real historical inefficiencies. If the market always opens at 9 and you find something that works at 9 then the probability that this is due to randomness drops dramatically since the number of random data arrangements where that price action happens at nine is drastically reduced.
buy provigil overnight delivery With these experiments and results I have to say that some of my instincts for the past few years have been wrong. Systems on the daily timeframes may be easier to create from a computational perspective and may have higher reward to risk ratios but their overwhelmingly high probability to derive from randomness – at least pertaining to price action strategies – makes them a very poor choice for live trading, especially when looking to profit from real historical inefficiencies. With quantitative proof showing both a high probability of these daily series in themselves to resemble random walks (statistical hypothesis tests) and the high likehood that systems have to come from randomness (often greater than 15% for most methodologies) shows that daily timeframe system generation is mostly an exercise in futility, at least for price action based systems for the Forex market under these conditions.
–
–
These findings also finally reconcile a conflict I had pertaining the difference between the number of historically profitable systems found in system searches and the probability of a series to be a random walk (since you would expect random walks to somehow lead to a lower number of profitable strategies). Indeed this research in DMB shows that the EUR/USD daily timeframe leads to a very large number of historically profitable strategies, but so do random series with the same distribution.
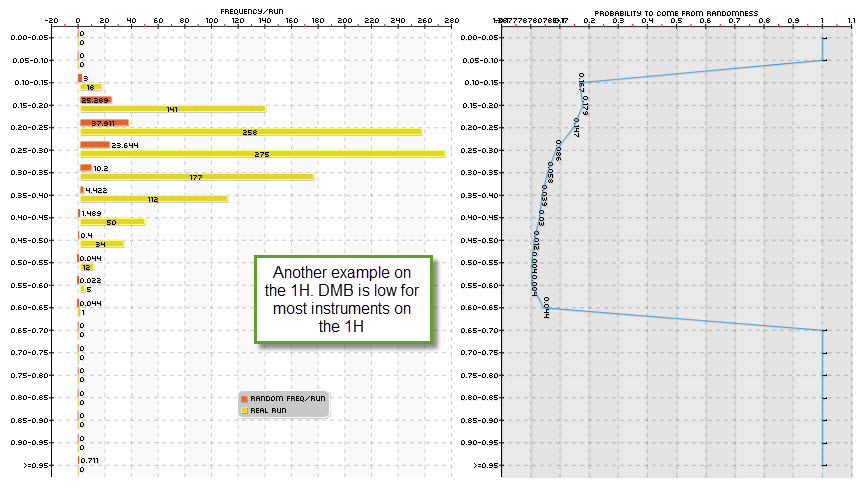
Happily, the results also show that the 1H timeframe is extremely promising for the generation of strategies across most symbols (even better on some symbols different than the EUR/USD) and most probably the 30 minute and 15 minute timeframes will yield similar results, although it is obvious that on such timeframes the computational effort needed to generate systems will be even larger (however within the grasp of our cloud-mining power). Note that we are just starting to explore the 1H timeframe – so we’ll generate many more experiments before fully understanding things – but it is now clear to me that this path does lead to much better trading systems from the perspective of DMB with equally good and sometimes even better historical result statistics. http://civilwarbummer.com/lincolns-fierce-rebuttal-or-o-b-ficklin-confessed/lincoln-1858/ We’re already testing several of these 1H systems live, hoping to understand how they behave and measure their performance.
If you would like to learn more about DMB and how you too can contribute to the creation of trading systems using our cloud mining pkantu implementation please consider joining Asirikuy.com, a website filled with educational videos, trading systems, development and a sound, honest and transparent approach towards automated trading in general . I hope you enjoyed this article ! :o)


Hi Daniel.
Excellent post, as usual, very scientific material, and that is what I am looking for.
Do you have a myfxbook account for tracking your live test?
There is any way to join asirikuy for a shorter period?
Reagards.
Hi Francisco,
Thanks a lot for your comment. Yes, there are several accounts in myfxbook tracking systems coming from both Kantu and PKantu (these accounts are only available to members via private links). Also there is no shorter subscription period, the minimum time is a year. Thanks again for writing,
Best Regards,
Daniel
Hi Daniel,
I recently found your blog by chance and I think it’s the only place where a scientific approach in trading is explained with such great details. I also understand the correct approach in trading forex from your free PDF file. Thanks for your good work!
One thing I try to understand but failed is what it means by bootstrapping mentioned in many places of your blog. By random data, do you mean you construct a random time series by randomly choosing data points (with replacement) in the original time series? Or does it mean constructing a time series where the return of it comes from the returns randomly chosen (with replacement) in the original time series? It would be very helpful if you could explain this in more details.
Thanks,
Tommy