As I have mentioned in my last post, the mining of trading systems is very sensitive to the pair that you’re creating a system for because the probability to generate a system with a given profitability from random data changes significantly as the characteristics of the instrument you’re mining for change. For example on instruments like the USD/CHF it is naturally harder to mine systems above randomness because of the very long term down-trend on this pair that makes the finding of random profitable systems much more likely than on other instruments which have less strongly biased histories. That said, the exit mechanism also plays a critical role in defining the probability to find profitable systems on random data because some exit techniques impose a given trade evolution that becomes highly unlikely on random data. On today’s article I will share with you some of our research using different exit techniques across different pairs, where you will be able to appreciate some key aspects pertaining to the data-mining of daily price action based systems across different Forex symbols. Please read my previous articles on data-mining bias before reading further.
–
–
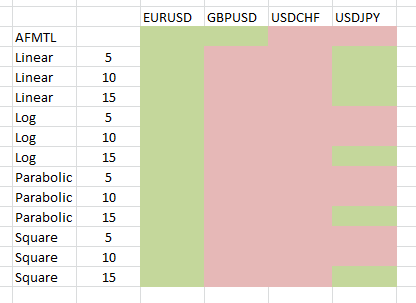
This small study focused on finding how the data-mining bias changed when changing the exit mechanism between a regular trailing stop technique and several function-based exits where the stop-loss value is moved as a function of time as a trade progresses. Function-based techniques do not depend on the underlying price action, as they attempt to impose a given trade evolution without which a trading system simply cannot be profitable. This trade evolution can be carried out according to several different functions, in this case we have tested linear, logarithmic, parabolic and square-root proportional evolution with 3 different break-even points (5, 10, 15). The break-even point determines the intercept between the function – which has a value of initial stop-loss at zero – and the trade open price. A break-even point of 10 means that after 10 bars the SL of the position is at the BE position. The stop-loss values keep evolving towards positive territory after the BE point as well. The study covered the four majors EUR/USD, USD/CHF, GBP/USD and USD/JPY with daily data from 1986 to 2014.
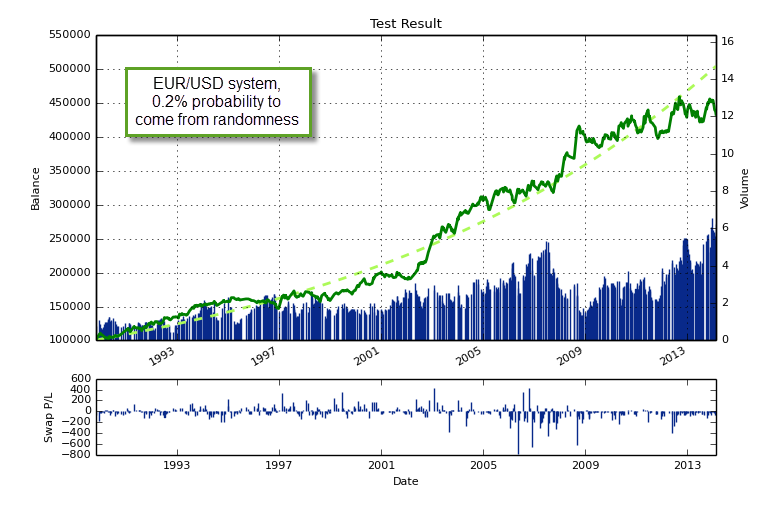
The image above shows you a summary of our testing results, green squares represent points where the probability of the top system class (sorted as a function of the profit to drawdown ratio) being randomly found is below 1% while the pink squares represent points where the probability was above this same number. The first thing we see here is that the probability to find real inefficiencies is simply highest on the EUR/USD, no matter what exit technique you use, this symbol is always able to yield results that can be easily distinguished from random results when you look at the top class. Looking deeper into the matter it does not seem to be that the probability to generate systems under random data is much smaller than for the other cases but that the frequency of profitable systems on the real data is simply much higher than that expected from randomness. This actually means that the presence of real inefficiencies on the real EUR/USD data is simply much higher than you would expect if the EUR/USD data was simply random data (as the bootstrapping exercise confirms). This is a formal confirmation that there are simply many more price action based inefficiencies present on the EUR/USD, at least on the daily data.
–
–
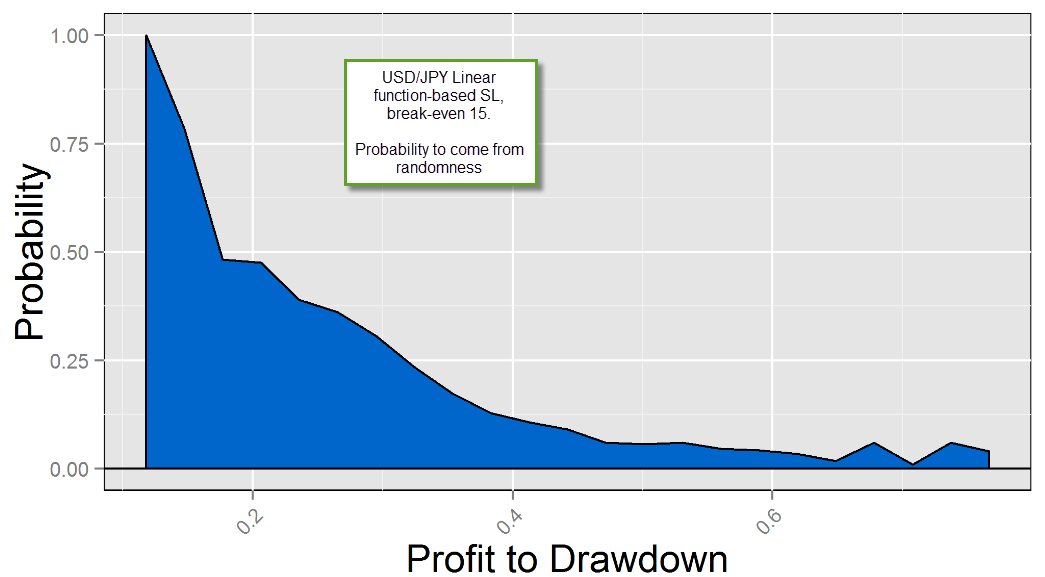
For the other symbols we have a somewhat heavy dependence on the exit mechanism. In the case of the USD/JPY, for example, we see an ample set of conditions where real inefficiencies can be found but this changes significantly as a function of the exit. In this case this can be attributed to the probability of finding such systems on random data, where the frequency of systems on random data changes significantly when you change the exit dynamic. For example when using linear exits the probability to find such systems under random conditions is quite low, while for the other exit techniques the probability to find such systems is much higher. The frequency of systems is rather similar across the real data for most exit techniques, but for some of these exits the probability to find random systems that fit them is simply much higher.
The next case we have – the GBP/USD – shows a very poor probability to generate systems above randomness, mainly because the frequency of highly linear systems across the real data is terribly low. Only for one case – the AFMTL, a typical trailing stop mechanism – do we have a good chance to find systems below randomness. This is not because the probability to find random systems with AFMTL drops significantly but because the frequency of profitable systems using this technique in real data is much higher than the frequency expected from randomness. It is also worth mentioning that such systems generally have quite long trade duration, a possible reason why none of the function based exits – which introduce tight trade evolution constraints – seems to have been able to work. Although the function based techniques do have a lower probability to generate systems in random data, the probability drops equally dramatically on the real data and therefore the probability to distinguish between random results and real inefficiencies is practically zero.
–
–
The USD/CHF case shows a dramatic example where being fooled by randomness is highly probable. In this case there is simply no instance where we can distinguish between real and randomly profitable systems with a high probability. The probability to generate randomly profitable systems is extremely high for this pair – at least on the daily time frame – because the long term bias of this instrument is very high. Practically any system that traded towards the short side and took only minor loses towards the long side would have been able to make a profit on almost all random permutations of the USD/CHF data during the past 25 years. This is because the structure of the symbol contains a natural bias that has been incredibly hard to outperform by a true historical inefficiency. The number of systems that are profitable in real data Vs those profitable in random data is always the same or even lower, implying that for this pair it is simply not possible to say if historical profit was generated simply because of luck or because of truly knowing something real about the pair. This confirms that beating markets with strong bias is always very hard, especially on upper timeframes where this bias is most evident.
This exercise on data-mining bias across the four majors shows us several different aspects of system data-mining. Being able to distinguish a real inefficiency from a random one requires us to have both a high probability to find such a system on real data and a low probability to find it across random data; therefore both strategies – increasing the number of systems in real data and decreasing the probability to find them on random data – seem to be valid in order to decrease data-mining bias. However increasing the number of systems in real data without increasing them in random data is a tricky business, as you will often increase/decrease both when performing changes. The data-mining bias determination procedure is self-correcting (you cannot fool yourself because everything you do affects results on both real and random data) and therefore it provides a great tool for the discovery of systems based on real historical inefficiencies.
That said, every data-mining bias determination is unique to the particular symbol/timeframe and mining properties used and therefore the above cannot be used to make any global assumptions. The lower timeframes offer particularly different properties to those of the daily timeframe (for example with the presence of volatility cycles) and therefore the above table will probably change significantly when we go to explore these instances. If you would like to learn more about system generation using our powerful GPU-based PKantu software please consider joining Asirikuy.com, a website filled with educational videos, trading systems, development and a sound, honest and transparent approach towards automated trading in general . I hope you enjoyed this article ! :o)


