On my last two posts about neural network systems using indicators as inputs – you can read them here and here – we discussed the use of two and one period RSI inputs and the effect of period and epoch variations on the results of a constantly retraining algorithm on the EUR/USD. These results showed that indicators represent adequate inputs for a neural network algorithm that retrains on every bar and showed how historically profitable results with high R² values can indeed be created. Today we are going to take these algorithms a step further to see if we can also get profitable and highly linear results with them on pairs different than the EUR/USD. On this post we will be looking at the multi-pair potential of the single period RSI based neural network algorithm and how the algorithm’s characteristics change across different symbols.
–
–
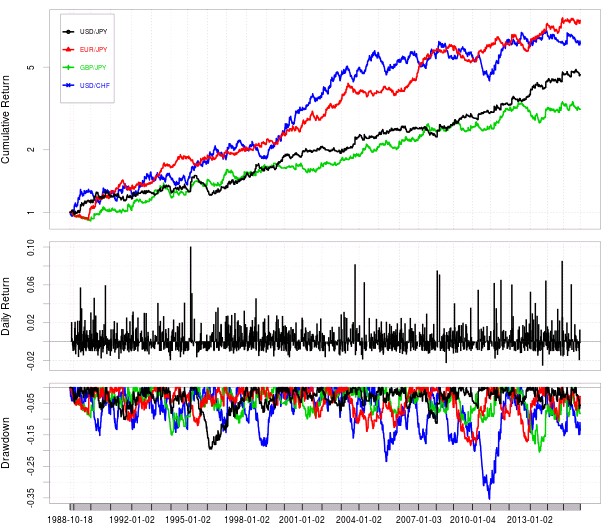
In order to see if the algorithm could work on different symbols I searched the parameter space of the algorithms on the USD/JPY, EUR/JPY, GBP/JPY, USD/CHF, GBP/USD, AUD/USD and USD/CAD from 1987 to 2015. As with other machine learning systems profitable results were not present on the AUD/USD, the GBP/USD or the USD/CAD as no system was able to adapt to changes in these symbols through the 28 year period. However on all other symbols highly linear and profitable results could always be found, with many parameters crossing the R²=0.9 threshold that I generally use to judge the stability of a trading system’s results. As it is shown in the image above results were most profitable on the EUR/JPY and the USD/CHF while the lowest profitability was seen for the USD/JPY and the GBP/JPY.
It is also worth noting that while results were most profitable for the USD/CHF and the EUR/JPY, the USD/CHF showed significantly poor results during the past 10 years with almost no gains and deep drawdowns in the algorithm from 2005 to 2015. This was seen for most highly linear parameters on the USD/CHF, most probably due to the increase in SNB intervention during the past 10 years which might have strongly affected the ability of such an algorithm to draw any significant predictions. As a matter of fact the biggest drawdown for this pair happens around the establishment of the EUR/CHF peg in 2011 which effectively changed the behavior of the USD/CHF to behave more like the EUR/USD. The pair also had quite different parameters from the JPY symbols, using very large RSI periods in the range of 70-90 with significantly large number of inputs used per training example (around 6-10 inputs per example).
–
–
In the case of the JPY containing symbol results we have that results are much more highly linear with the R² always going above the 0.95 mark. Especially impressive are the results for the USD/JPY system which has an R² above 0.98. Such stable results come from an almost constant predictive capacity from the machine learning algorithm through the entire testing period. It is worth remembering that retraining of the NN happens on each bar, so such linearity does not come from any type of data snooping bias from the training of the machine learning algorithm. Most notably recent USD/JPY results show the lowest drawdown periods while both the EUR/JPY and the GBP/JPY had important dips during the past ten years. It is also interesting to note that the correlation within the three systems is rather low, although they are all related by the influence of the JPY. From the top 10 drawdown periods between the three systems very few overlap between the three in a meaningful manner.
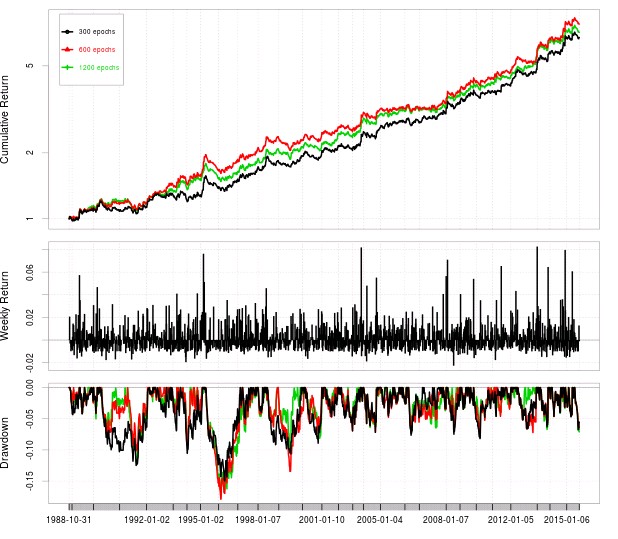
As in my previous post about single period RSI based algorithms I also wanted to test whether these algorithms were properly trained or whether adequate training at 300 epochs was a phenomenon that changed depending on the currency pair. In this case increasing the training threshold from 300 to 1200 did not influence results very significantly although a slight increase in profitability could in fact be seen on all symbols. However in all cases this improvement in profitability is seen on single periods within the test (mostly in 1990-1995) pointing to the fact that this increase in training epochs does not provide an overall improvement on constant retraining and therefore the 300 epoch choice is adequate for most of the simulated periods.
I would also like to point out that the parameters for the USD/JPY, EUR/JPY and GBP/JPY are rather similar, something that would be expected from their common JPY origin. All the systems use rather low RSI periods (5-20) and use a small number of inputs for the construction of examples used for training (2-4). This reveals that most relevant information for predictions happens in the recent past and that looking further into the past does not lead to better predictive ability. In contrast with the USD/CHF symbol were both periods and input numbers were rather high.
In general I am happy to say that RSI based machine learning algorithms seem to be able to lead to profitable and highly linear results on several other currency pairs and could therefore be considered viable candidates for the creation of machine learning systems for the Forex market. Of course adequate mining bias measurements would need to be carried out to see if the algorithms come from spurious correlations something that is doable thanks to the fact that this small NN setups can be simulated very efficiently on F4. If you would like to learn more about how we measure mining bias and how you too can create your own machine learning based systems please consider joining Asirikuy.com, a website filled with educational videos, trading systems, development and a sound, honest and transparent approach towards automated trading.


