The OpenKantu free and open source trading system generator allows you to search for trading strategies with any desired historical performance characteristics. This enables the possibility to create strategies that have very large potential to fail under real out of sample conditions (live trading) depending on the user’s knowledge about statistical bias sources such as curve-fitting bias and data-mining bias (DMB). On today’s post we are going to look at how strategy generation on the program is affected by the use of a TakeProfit, how this leads to the often desired “high winning rate” and why and how this ultimately exacerbates the probability that the systems will fail to perform according to their historical results. This constitutes a fairly important exercise on why data-mining bias is important and why measuring it directly or taking very strong measures to make it as low as possible is extremely important.
–
–
Let’s say you are a new trader to algorithmic system generation and you want to create something that does not disappoint, you want an algorithm that is able to give you the highest possible wining rate so that you can have the largest possible amount of profitable days. This is an almost universal ambition of novice traders, to be able to attain very high win rates in order to have the most possible sense of accomplishment and the fastest possible compounding rates. Of course, given a goal to increase capital in an extremely fast manner something that has a higher winning percentage of trades gives a much faster way to achieve this target provided that both the high win rate and the expectancy are sustainable in the long term (this is a key assumption that is seriously flawed as we will see later on).
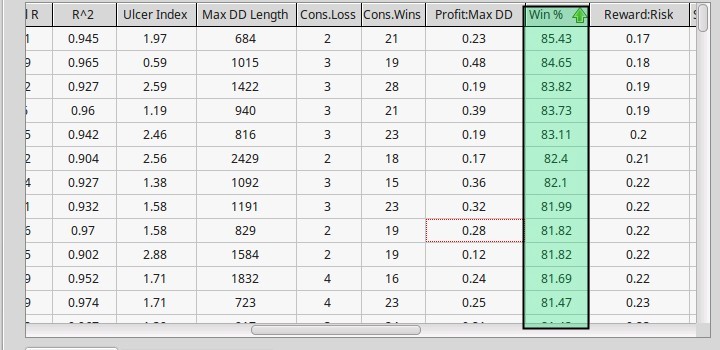
There are not too many things that you can do to achieve the above mentioned target. If you try to search for patterns with high win rates without imposing any sort of stop loss or take profit you will notice that your win rates will always fail your expectation and they will remain in the 40-50% range most of the time, try putting a stop loss in place and you will see these rates drop even more to systems with 20-40% winning rates. As a matter of fact the only way to achieve very high winning rates is to set a take profit and either avoid using or use a very large stop loss. Using a TP of 50% of the ATR as a fixed TP and avoiding the use of an SL gives you systems that in fact have high win rates in the 70-90% range. The above chart shows you a small sample of systems generated under such conditions on the EUR/USD 1D charts. Note that the systems always have a way to exit trades besides the TP because OpenKantu systems always work on a stop-and-reverse manner when having a trade opened and faced with a signal in the opposite direction.
–
–
The first thing that you notice from the above image is also that the Reward to Risk ratio is extremely low for these strategies, in the order of 0.1-0.25. This is not surprising since the winning ratio and the reward to risk ratio are always strongly and inversely proportional. It is evident that given the chance we would all want to have systems with both great winning ratios and great reward to risk ratios but the market is efficient enough to strongly forbid the existence of such systems. In practice whenever you search for systems you will find that trying to affect one variable will inevitably affect the other. This is especially true when you attempt to constraint the winning or losing possibilities within your strategy by placing SL or TP targets. However given that the winning rate is so high you are willing to deal with losses that are 4-5x the size of your average winner since you prefer to win most of the time and just take some loss from time to time.
But there is something seriously wrong with this assumption. Systems that have such high winning ratios have a problem dealing with the probability that such results can be achieved simply due to chance. Since the hitting of a low profit target is much more likely than the hitting of a loss due to a logic mechanism or a far away SL there exists a very large probability that such setups can be found simply through a mechanism that has no merit but entering at some favorable random points within the chart. It is not that the entry signals are predictive of what is going to happen but simply that being profitable is much more probable than coming at a loss. If you look at a large number of potential system candidates then at least some will achieve a very high winning ratio simply due to spurious correlations. Measuring the DMB of such setups always gives very large values. This means that the probability that a setup was just found by chance due to the strength and characteristics of the mining process is high. It is so high in fact that the above mentioned method where you search a system with a TP of 50% of the ATR(20) on the EUR/USD daily chart with an 85% winning rate gives a mining bias measurement of 100%. This means that the number of systems that are expected from spurious correlations is even higher than the number I found.
–
–
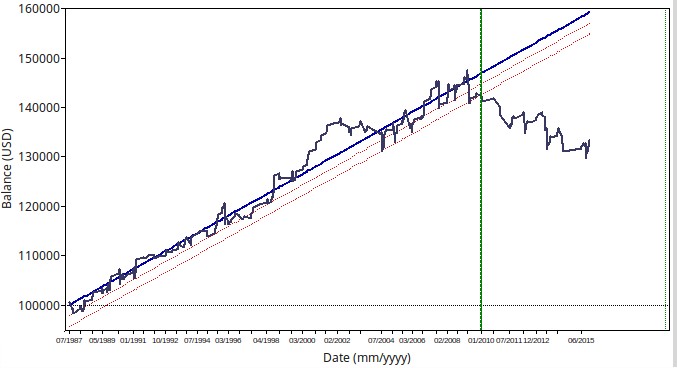
This very large mining bias manifests itself in the majority of generated systems failing under conditions that are outside of their mining range (see an example on the second image above). This means that if you mine a system with these characteristics from say 1988-2010 and then test the 2010 to 2014 period you will find that most systems mined will fail bluntly in 2010 to 2014. This failure is a consequence of the big mining bias that was present in the system generation period as a consequence of the constraints used in the design of the strategy. The high winning rate generated by the TP constraint causes the mining bias in our generation procedure to increase exponentially. This is due to the natural tendency of winners to be more likely than losing trades under these conditions and the statistical sample size not being large enough to see a true manifestation of all potential losing trades. This is why most successful systems are actually the complete opposite – systems with SL and no TP – because in that case you make the SL the common choice (losers are much more likely than winners) and you get a good measurement of all your losers and an underestimation of your potential winners.
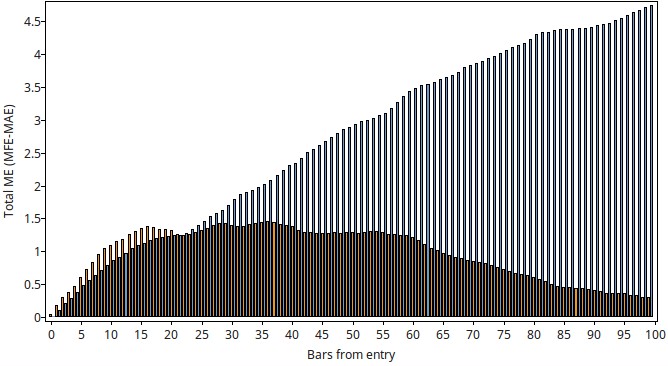
Another point I want to make – with the last image above – is that the mathematical expectancy of a system with a TP looks like a complete waste of potential. If you look at the difference between Maximum Favorable/Unfavorable Excurcions for the systems with a TP value you will notice that the ME is often positive for both long/short trades but as a matter of fact the maximum achievable favorable excursion is well below what the system is taking as a TP. Not only are you increasing your mining bias greatly but you are also missing on the opportunity to take much larger profits because you are more interested on taking frequent profitable trades. This further highlights why the SL, no TP systems are much more successful in real life, in reality you need to take whatever the market is willing to give you, when it is willing to give it to you.
The above points go back to an old trading adage. Keep your losers short, let your winners run. Not only does designing strategies in this way lead to much better exploitation of favorable trading opportunities but it also leads to systems that by nature have lower levels of mining bias. If you would like to learn more about automated system design and how we automatically generate systems having these principles in mind please consider joining Asirikuy.com, a website filled with educational videos, trading systems, development and a sound, honest and transparent approach towards automated trading.


