These past few weeks we have explored the results of using the RSI as an input source in the construction of neural network trading strategies for the Forex market (see here, here and here). Through this research we have seen that the building of historically profitable, constantly retraining machine learning systems is indeed possible using this indicator. With this in mind it is not a significant leap to consider whether other indicators might give us similar but yet uncorrelated results that may help us compliment an eventual neural network system portfolio based on indicator inputs. Today we are going to explore the use of another indicator – the commodity channel index (a.k.a CCI) – in the construction of the same type of strategy. We are going to see how it behaves regarding period variations and training epochs as well as how the generated systems have in common and in what ways they differ from our previously studied RSI cases.
–
//code modifications in the regression_i_simpleReturn_o_tradeOutcome function

for(j=0;j<barsUsed;j++){
       inputs.element(m)[j] = iCCI(0,indicatorPeriod,tl+j+i+1)/100;
        }

//code modifications in the p_regression_i_simpleReturn function


for (j=0;j<barsUsed;j++){
         inputs.element(0)[j] = iCCI(0,indicatorPeriod,j+1)/100;
		}
–
So why use the commodity channel index? The RSI is an indicator based mainly on the idea of quantifying movements within a given set of periods as either entirely bullish (100) or entirely bearish (0) (read more about the RSI here). However the RSI contains only limited amounts of information as it only uses information from price returns to form its values. The RSI has no use of the high and low candlestick values which are another source of information within a traditional OHLC price series. In contrast the commodity channel index uses a simple moving average of the typical price which contains high, low and close values plus the standard deviation of the series. From this point of view the commodity channel index is a more complete indicator compared to the RSI. To include the CCI within our neural network systems in F4 we need to perform the simple modifications showed above to the regression_i_simpleReturn_o_tradeOutcome and p_regression_i_simpleReturn functions in the AsirikuyMachineLearning project.
–
–
Performing some basic optimization tasks we can obtain a neural network CCI based strategy that gives some highly linear and historically profitable results on the USD/CHF. The system trades only at 9 GMT +1/+2 and the neural network is retrained before every trading decision is made. The neural network builds 255 examples for each training by scanning previous historical data and locating each trading hour, then using the 4 CCI values before each target hour as inputs and the outcome of both long and short trades taken at the open of that hour and managed using a simple trailing stop mechanism as outputs. The neural network has a topology of 4 input neurons, 3 hidden neurons and 2 output neurons. Positions also use a stop loss equal to 50% of a proxy of the daily ATR(20).
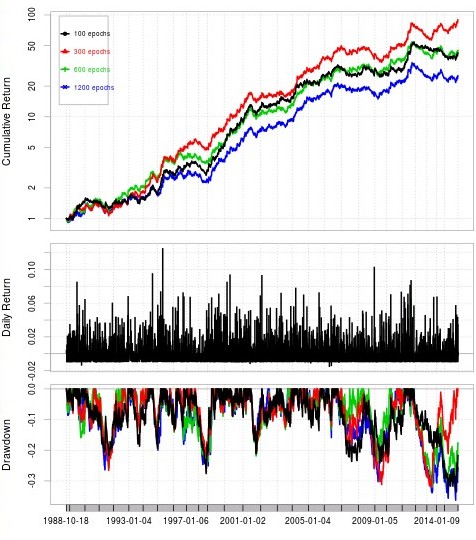
The results show that the CCI strategy achieves similar Sharpe ratios to those of the RSI based systems. Correlation with previously described RSI systems is also quite low, with an R of 0.45. However it is worth noting that the CCI systems have a much higher compounding efficiency, thanks to the much smaller initial stop loss value which makes trading more frequent. Another important difference is the sensitivity to training epochs. In the case of the RSI we had a basic minimum needed for adequate performance but increasing training epochs did not provide a significant decrease in profitability with results basically stabilizing at high epoch values. However in the case of the CCI strategy we do have a substantial over-fitting of results as we go into higher epoch values, meaning that neural network training is only ideal within a narrow epoch range.
–
–
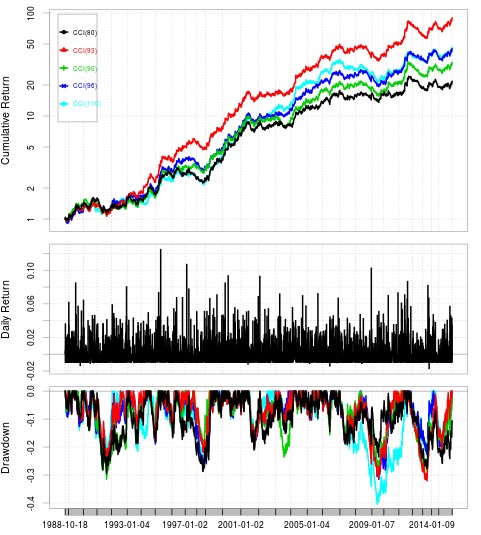
When we look at variations in the CCI indicator’s period we see similar behavior when compared with the RSI case. We see here that results vary strongly after we change values away from the initial optimum but they remain fairly constant even when we apply drastic changes to the CCI period. It is also worth noting that some trading system characteristics – such as the R² – actually see an improvement with this period variation while others remain fairly constant. You can see above the daily Sharpe ratios (to make them annual multiply by sqrt(252)) for the different periods. It is clear that the CCI 93 (the original found value) has the highest Sharpe but the decay when going to much higher values is not very important. In fact results for 90, 96 and 110 periods are fairly similar while going to significantly shorter periods (80) does cause a significant decline in this value.
Here we have seen how the building of neural network strategies using technical indicators is not only limited to the RSI but can be expanded to use other indicators as inputs. The CCI presented similarities with the RSI case in several regards although it was clear that some aspects (like behavior towards epoch variations) were completely different. Now that we know that several indicators can indeed work at inputs it is interesting to ask whether indicator combinations might actually give better results. The exploration of both mixed inputs and ensembles is something that we will be leaving for future posts. If you would like to learn more about how you too can program and build strategies using constantly retraining neural networks and other machine learning algorithms please consider joining Asirikuy.com, a website filled with educational videos, trading systems, development and a sound, honest and transparent approach towards automated trading.


Thank you D. for sharing this with us.
As long as we are using non-lagging indicators as input, we are able to find uncorrelated systems.
It might me not a perfect example but using precalculated indicators value I would compare with building a machine from elements which are produced by different vendors/countries. Only a good designer is able to combine them together to construct a great robot/machine etc.
For instance building a PC: there are some simple elements like different metals / semiconductors , plastic etc. But it is not sufficient, you need to make something from those simple elements (like price ) – RAM/CPU/HD/MB etc – and when combined together produce PC.
The same here, some smart people invented Indicators which are based on the Price, so we can use those components and build something more robust and resilient.
Let’s see how it works in F4.