The first battle that algorithmic retail Forex traders have to face is the acquisition of high quality historical Forex market data. This is not very easy to do since the Forex market does not have a centralized exchange and therefore historical data can come from a wide variety of different data providers, some of which can be terribly unreliable. Currently there are no easy-to-use tools that I am aware of that can help the retail trader streamline the process of assessing data quality, making it quite difficult for the novice trader to actually know if the data they are using is or is not reliable. On today’s post I am going to share with you a basic python script that new traders can use to evaluate the quality of data in the MT4 history center format. Through this post we’ll learn what the script does, how it does it and how you can use it to know whether you Forex data looks or not like a piece of Swiss cheese.
–
#!/usr/bin/python
# MT4 format data quality evaluation script
# By Daniel Fernandez, 2015
# Mechanicalforex.com
# Asirikuy.com

import subprocess, os, csv
from time import *
from math import *
import pandas as pd
import numpy as np
import sys
import fileinput
from datetime import datetime
from datetime import timedelta
import matplotlib.pyplot as plt
import argparse

ohlc_dict = {
    'open':'first',
    'high':'max',
    'low':'min',
    'close': 'last',
    'vol': 'sum'
}

parse = lambda x: datetime.strptime(x, '%Y.%m.%d %H:%M')

def monthlyDistribution(df):

    fig, ax = plt.subplots(figsize=(10,7), dpi=100)
    n, bins, patches = ax.hist(df['month'], 12,facecolor='green', alpha=0.75, align='left')
    plt.xlabel('Month')
    plt.ylabel('Frequency')
    plt.title('Missing data distribution by month')
    plt.grid(True)
    labels_x = ['Jan','Feb','Mar','Apr','May','Jun','Jul','Aug','Sep','Oct','Nov','Dec']
    ax.set_xticklabels(labels_x, minor=False)
    ax.set_xticks(bins[:-1])
    plt.xticks(rotation=90)
    plt.show()

def yearlyDistribution(df):
    fig, ax = plt.subplots(figsize=(10,7), dpi=100)
    n, bins, patches = ax.hist(df['year'], len(set(df['year'])), facecolor='green', alpha=0.75, align='left')
    plt.xlabel('Year')
    plt.ylabel('Frequency')
    plt.title('Missing data distribution by year')
    plt.grid(True)
    labels_x = list(set(df['year']))
    ax.set_xticklabels(labels_x, minor=False)
    ax.set_xticks(bins[:-1])
    plt.xticks(rotation=90)
    plt.show()

def main():

    parser = argparse.ArgumentParser()
    parser.add_argument('-f', '--filename')
    parser.add_argument('-tf', '--timeframe')
    args = parser.parse_args()

    filename = args.filename
    timeframe = args.timeframe

    if filename == None:
        print "Filename missing (-f)."
        sys.exit()

    if timeframe == None:
        print "timeframe missing (-tf)"
        sys.exit()

    historyFilePath = filename
    timeframe = timeframe

    if "JPY" in historyFilePath:
        roundFactor = 3
    else:
        roundFactor = 5

    df = pd.read_csv(historyFilePath, index_col=0, engine='python', parse_dates = [[0, 1]], header=None, date_parser=parse)

    df.columns = ['open', 'high', 'low', 'close', 'vol']

    df = df.round(roundFactor)

    df = df.resample(timeframe, how=ohlc_dict, base=0)
    df = df.reindex(columns=['open','high','low','close', "vol"])

    hour = df.index.hour
    dayofweek = df.index.dayofweek
    selector = ((0<dayofweek) & (dayofweek<4))
    df = df[selector]

    day = df.index.day
    month = df.index.month
    selector = (((day != 24) & (day != 25) & (day != 26) & (day != 31) & (month==12)) | ((day > 2) & (month==1)) | ((month > 1) & (month < 12)))
    df = df[selector]

    missing_data = df[df.isnull().any(axis=1)]

    missing_data_count = len(missing_data)

    missing_data['year'] = missing_data.index.year
    missing_data['month'] = missing_data.index.month

    monthlyDistribution(missing_data)
    yearlyDistribution(missing_data)

    print " "
    print " "
    print "Number of expected data points {}".format(len(df))
    print "Amount of missing bars {}".format(missing_data_count)
    print "Data is missing {}% of data points".format(100*missing_data_count/len(df))
    print " "
    print " "


##################################
###           MAIN           ####
##################################

if __name__ == "__main__": main()
–
Before using the script above please make sure you have the matplotlib, pandas and numpy python libraries installed, you can install them using the “pip install libraryname” command if you are using one of the latest versions of the python interpreter. This script uses python 2.7.x so don’t try to run it with the 3.x versions. After you get everything installed you’ll need to get your historical data into a format that the data quality processing script can read. The script reads data in MT4 history center format so if you’re using this platform you can simply export your data from the history center which will generate a csv file that the script can use. If you have data in another format you can change line 82 (that contains the call to the pandas read_csv parser) to specify the correct data format and date parser requirements.
–
B       business day frequency
C       custom business day frequency (experimental)
D       calendar day frequency
W       weekly frequency
M       month end frequency
BM      business month end frequency
CBM     custom business month end frequency
MS      month start frequency
BMS     business month start frequency
CBMS    custom business month start frequency
Q       quarter end frequency
BQ      business quarter endfrequency
QS      quarter start frequency
BQS     business quarter start frequency
A       year end frequency
BA      business year end frequency
AS      year start frequency
BAS     business year start frequency
BH      business hour frequency
H       hourly frequency
T       minutely frequency
S       secondly frequency
L       milliseonds
U       microseconds
N       nanoseconds
–
Once you have your historical data in the correct format, all python libraries installed and you have saved the script to your computer – as check_quality.py for example – you can use the script by calling the command “python chech_quality.py -f dataFilename -tf timeframe”. The script requires to arguments, the “-f” argument that specified the data filename you want to check and the “-tf” parameter that specifies the timeframe of your data. This timeframe needs to be specified according to the pandas resampler conventions (which I also summarize above). This means that if you are using 15 minute data (which is traditionally 15M) The actual timeframe you need to input would be “-tf 15T” because in pandas the convention for minute is “T” and not “M” (M is used for monthly data). If you have 1H data you can use “-tf 1H”.
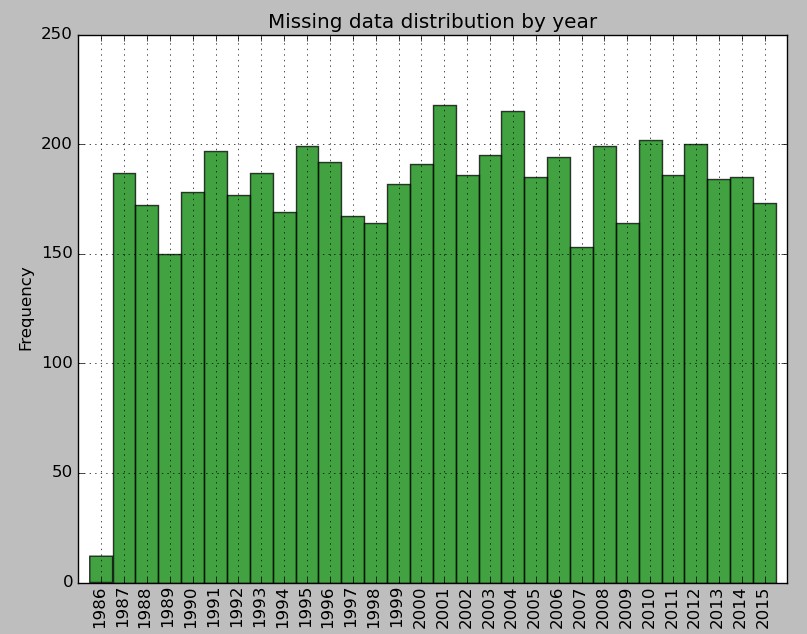
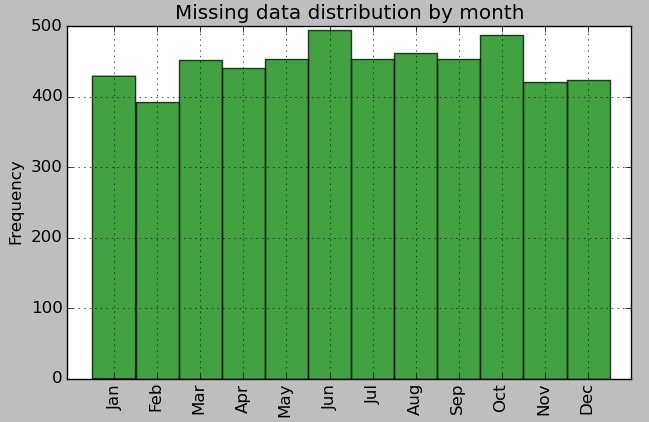
What the script does is simply to load your data into a pandas dataframe, perform a resampling using the same timeframe as the data (which fills it with all the time stamps it should have if it was complete, with null values where you have missing data), filter week-ends and holidays (Dev 24, 25, 26 and Jan 01,02) and then check to see how many bars are missing and plot the distribution of when the data is missing in terms of months and years. After the script executes you will get a small summary telling you the total number of expected data points, the number of missing bars and the percentage that these bars represent from the overall data.
–


–
I have taken a 1H data sets from the data we use at Asirikuy (which has no missing bars) and have used the pandas sampling function (df.sample(frac=0.95)) to randomly strip out 5% of the data to show you how the expected output should look like (see above images). As you can see above the script correctly detects that 5% of the data is missing, which represents 5363 bars from the 107125 that were expected by the program. The script then plots the monthly and yearly distributions of how this data null data is distributed, which shows us that the sampling function has indeed removed 5% of data randomly from the entire data set.
Using the above script anyone using data in the MT4 format can very easily assess an important part of their data quality. However it is important to note that missing bars are only one component of data quality as other things such as spikes can also play a fundamental role in determining how high the quality of your data is. It is also possible that a data provider would remove missing data by doing some sort of interpolation or replacement (for example replacing missing bars with the bar right before it) which may also make you think that your data quality is higher than what it really is. It is also very important to consider that missing bars are normal under lower timeframes. When you have something like a 1M timeframe you would indeed expect to have some percentage of data missing because the market is not active on absolutely every minute. Around 1-2% of the data can be missing due to this fact (low liquidity that means no trading around 1-2% of the time). However on timeframes above 10M the amount of bars missing should in fact be zero for a high quality data set.
If you would like to learn more about data analysis and obtain long term Forex data that you can use for your own system design and analysis please consider joining Asirikuy.com, a website filled with educational videos, trading systems, development and a sound, honest and transparent approach towards automated trading.


