If algorithmic traders could have one wish it would probably be to have a system where the drawdown period length was always zero. Drawdowns are the main negative aspect when trading, periods between equity highs where your systems are failing to provide you with any profit, periods where your strategies are not extracting any value from the markets. There are however ways in which we can reduce drawdown period lengths and depths, mainly by attempting to couple strategies that have low correlations such that when a strategy is in profit the other one will be in drawdown and vice versa. Through this post I will show you why this strategy is inherently limited and why there is a cap to the reduction of the maximum and average drawdown lengths that is realistically achievable.
–

–
As I explained in a recent post about large portfolios and diversification having trading setups formed by large numbers of uncorrelated systems has huge advantages. The diversification provided by coupling uncorrelated strategies decreases the volatility of the overall setup and tends to reduce all downside statistics while maintaining or improving most positive aspects. It is no mystery – we know it thanks to Markowitz in the 1950s – that coupling uncorrelated income generators is one of the best ways to make your trading better. However it is worth asking whether there is a limit to how much we can improve a setup by putting uncorrelated strategies together. Can we make a portfolio infinitely better by adding and adding new trading systems? Is there a limit to how much we can improve things?
I sought to answer that question, especially as it relates to the maximum and average drawdown lengths of a trading portfolio. I chose drawdown length because I believe this to be one of the most key statistics in trading system performance. If you could reduce your maximum and average drawdown lengths to something close to zero you could make a trading setup that was both extremely profitable and extremely easy to trade. Imagine if you could trade a system with a maximum drawdown length of just a week, you could trade with confidence knowing that you will on average get out of drawdown periods extremely quickly and at a worst case it might take you just a few weeks to see a new equity high. Your cash flow would be glorious and your investor would be ecstatic.
–

–
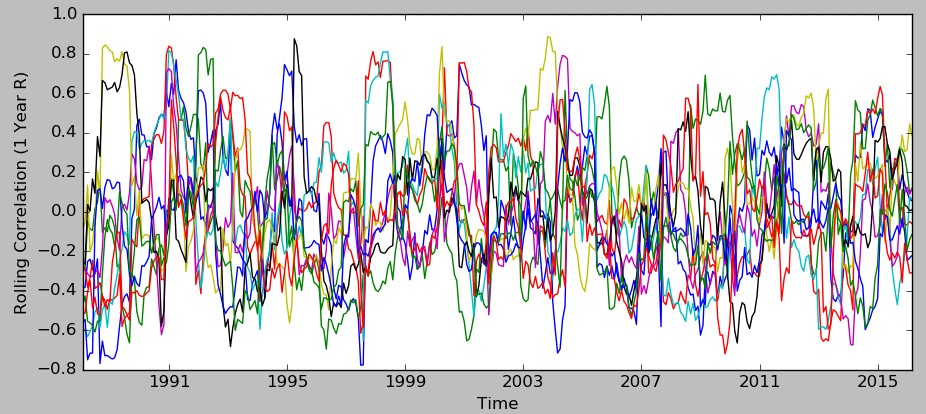
Sadly there is indeed a limit to how much you can reduce your maximum drawdown length and it comes from the very nature of trading systems. When we add strategies that are globally uncorrelated – the Pearson correlation between their return series is low – we look at a global correlation measurement but there are indeed periods where there are higher correlations present. The first graph above shows the one year rolling correlation between a sample system and 20 other systems where the global correlation coefficient between them is always below 0.5. You can locate several points where the correlation goes above 0.8 and this tends to happen between different systems and often within drawdown periods. Even if you filtered systems using something like the RCI instead of the pearson correlation to create a portfolio the scenario would be almost identical because you only need a few peaks to align to deepen or elongate a drawdown.
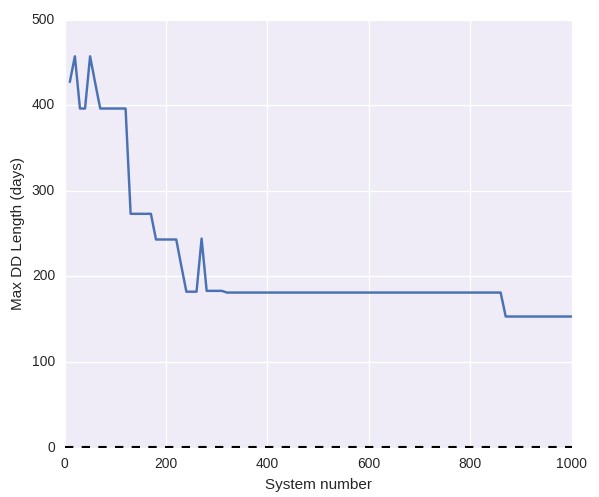
The fact that there are correlation peaks between systems – even if overall correlations are low – implies that no matter how many uncorrelated systems you try to add there will always be drawdown periods where there are peaks that align. If you look at the maximum drawdown length as a function of the number of trading systems within a portfolio (assuming an equal system weight division) the maximum drawdown length does drop dramatically as you start adding systems but the drop follows an exponential function and quickly reaches a point where a further drop requires a very large addition of trading systems. Dropping from 400 days to 200 days takes 200 systems but dropping from 200 to 150 takes an additional 800 strategies. You get 1/4 the drop with 4 times the effort. If you calculate an exponential regression using the above data then you will see that to get to 112 you will need around 2400 systems and to get to 84 days you will need at least 9600 strategies. In the end you end up reaching a tangent where you converge to a level of around 50-60 days as probably the deepest possible drawdown reduction at around 50,000 systems.
–

–
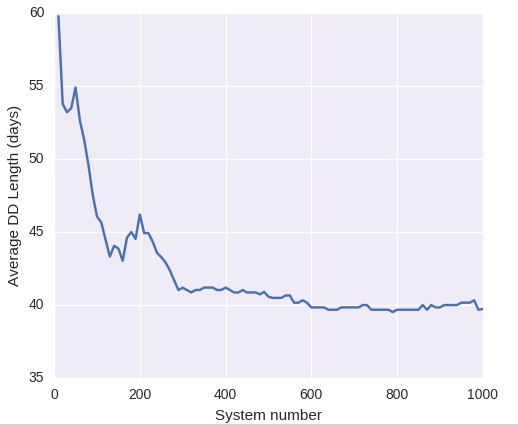
The average drawdown length follows a very similar process. The average drawdown length drops pretty dramatically in the beginning but the effort required to further reduce the average drawdown length becomes more and more impressive as we go to lower values. The increases in system correlations at certain points in time plays the same tricks on us as it did with the maximum drawdown length. There is a certain point, a barrier we cannot breach and this barrier means that regardless of how much we try at some point it becomes impossible to push the drawdown statistics lower. There is a fundamental limit that is inherent to the very nature of how systems interact and – more importantly – the nature of the markets.
The above phenomena are derived from the randomness of short term returns. We can to some extent know the expectation we have when entering a series of trades according to some logic – we can derive reasonable probabilities from historical analysis – but the individual outcome of each trade is a mystery due to the randomness inherent to short term movements within the market. We may know that if we enter 100 trades with X logic we are bound to make a profit in A% with a B reward to risk ratio but we have no idea whether the 10th trade of the series will be a winner or a loser and hence we cannot see past this mist. The limit in the reduction of the drawdown statistics speaks about this fact, you cannot reduce these further because you cannot have insights into short term correlations, into the randomness of how systems will interact within the next few trades.
If you would like to learn more about trading system creation and how you too can learn to perform data-mining to find large numbers of systems while properly assessing problems such as data-mining bias and correlations please consider joining Asirikuy.com, a website filled with educational videos, trading systems, development and a sound, honest and transparent approach towards automated trading.


Hi Daniel,
From your analisys and the point of view of reducing drawdown length it seems that there is no need to execute porfolios of more than 300-400 systems. However, could exist any reason to add more than 300-400 systems?
Best Regards,
Quique
Hi Quique,
Yes. There are many reasons to execute big portfolios besides drawdown reduction in the in-sample statistics. In reality you don’t know which systems will work in the out of sample and which ones do not and having as many systems as possible protects you from the selection bias you go into when you select only 300-400. Even if the in-sample drawdowns won’t decrease very strongly after this point the probability to achieve better out of sample statistics does increase. For this reason it’s always good to trade as many systems as can be traded, because the real objective is to achieve good out of sample statistics not just the best possible in-sample result. Since the future is unknown – we don’t know which systems will match their in-sample statistics going forward – we need to trade as many as possible to protect ourselves. Thanks again for writing,
Best Regards,
Daniel