The distribution properties of financial time series returns have been an interesting topic of discussion during the past 60 years. Lots of effort has gone into the study of these properties as well as into discussing why these properties are different from the properties of a simply random walk and why this might be important. Today I want to write a post about why the statistical properties of the distribution of returns can tell us nothing about whether a series is efficient or not and why there is often some confusion about this matter. I will be talking about some of the differences between the distribution properties of a random walk and those of a real financial time series as well as why this does not imply that any type of inefficiency actually exists within price data. In the end you’ll see that the distribution properties are of limited usefulness when creating systems to actually find and exploit inefficiencies in financial time series.
–

–
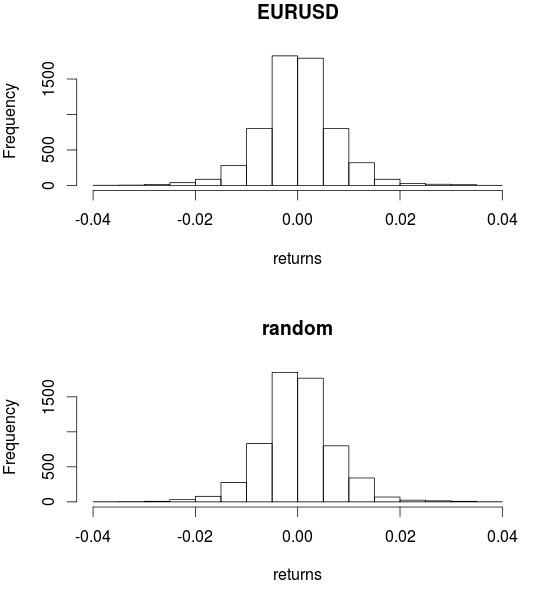
The distribution properties from the returns of financial time series and a random walk are certainly very different. The biggest difference is probably that a random walk is normally distributed while a regular financial time series has abnormal kurtosis that is normally associated with the presence of fat tails within the distribution. This means that within real financial time series there are usually bars that are much bigger than those that are expected from a simple random walk, there are many more large bearish and bullish bars than what we would expect from a random walk process. However this presence of abnormal tails does not imply that there are mechanisms to generate money from predicting the future using the past within the series, it merely points out there is an unexpected presence of large bars.
The above can be explained by what constitutes a market where new information is introduced at fixed points in time which causes markets to react strongly to “correct price” to match this new data. This means that at some point some things happen which cause participants to react more so than usual but it does not say anything about whether those movements occur within any predictable frame set. So a series may deviate from what you expect from the behavior of a normally distributed random walk but this in no way implies that the series can be predictable, the series is merely a random walk with some peculiarities in the tail structure which make it look different than a regular gaussian random walk. Some people read that a series is inefficient due to the presence of these fat tails but as I have exposed above there is simply nothing that makes this the case.
–

–
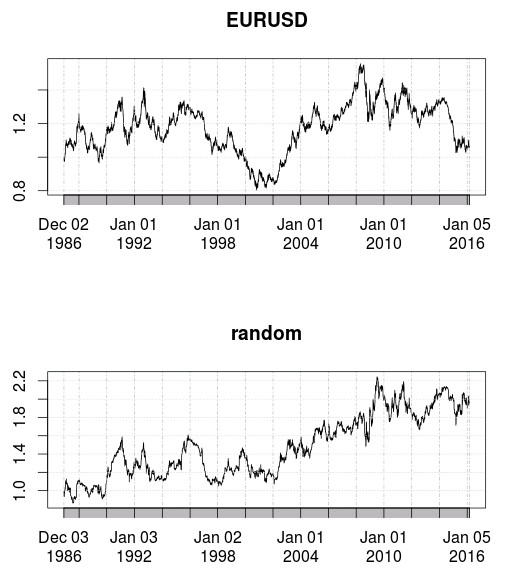
The easiest way to demonstrate the above is to take any financial time series and generate a new series that has the exact same distribution of returns using bootstrapping with replacement (showed in the images above). In the case of the EUR/USD you can go from a series where there are many historical inefficiencies present to a series where you have absolutely nothing to find above random chance. The shuffling of the returns destroyed any potential for predictability within the series yet we see the exact same distribution of returns with the exact same fat tails and the exact same deviated kurtosis value. In the end you get a series that you could undoubtedly distinguish from a gaussian random walk – you can still see the fat tails and other differences – but for which the actual number of real inefficiencies present is guaranteed to be zero from the shuffling process.
This tells us why it’s so important to never just compare statistical properties with those expected from a simple random walk because financial time series simply do not conform to all the distribution properties from a normally distributed random walk process. This means that a property like a fractal dimension could be under or over-estimated – compared to what you would expect from randomness – simply because of the distribution properties of the series. In order to compare any property within a time series and relate this property to inefficiencies it is important to draw a standard for randomness that is derived from the generation of random series as pictured above. With that in mind you can measure a property across a set of random series with the exact same distribution properties as the original series – but no inefficiencies present at all – and you can then derive conclusions based on the difference between these values expected from a shuffled sampling with the same distribution and your data potentially containing some inefficiencies.
–

–
As you can see the above constitutes a quite basic but yet very important insight into financial time series. It is not the distribution of returns that matters but how the other non-distribution dependent properties of your series compare with those expected from perfectly efficient curves coming from the same distribution. If you have a series filled with inefficiencies then there should be some important differences between properties that depend on the exact ordering of the data within the series – such as many Chaos related properties – between the random curves and your real data. However it is clear that simply having fat tails within a series – or any difference on any other distribution properties with a gaussian random walk – is meaningless when it comes to your ability to draw useful predictions. If you would like to learn more about financial time series and how you can derive historically real inefficiencies from a price series please consider joining Asirikuy.com, a website filled with educational videos, trading systems, development and a sound, honest and transparent approach towards automated trading.strategies


