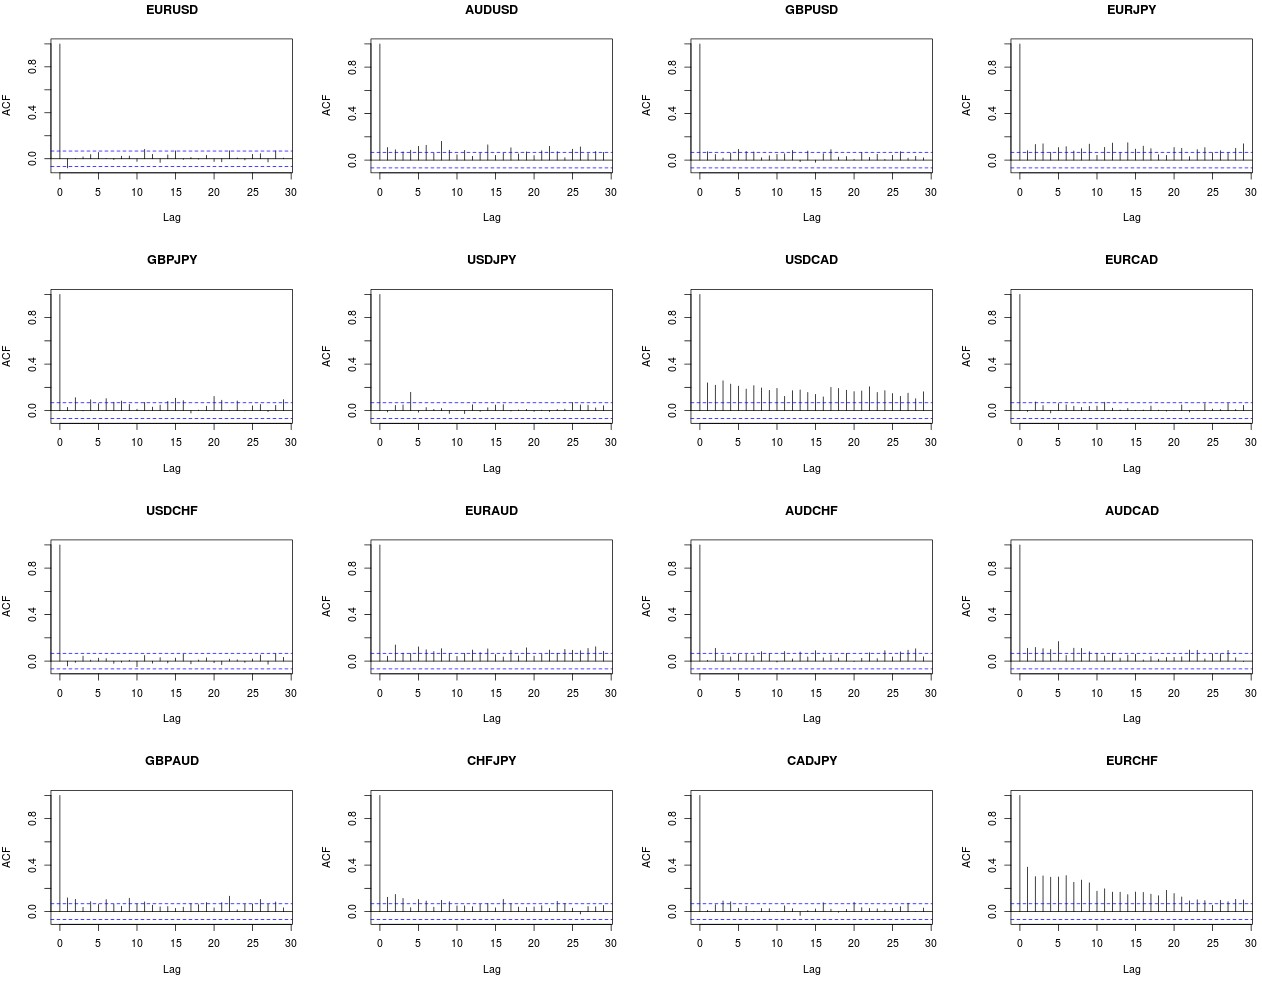
Last week we explored the standard deviations and autocorrelations of the fractal dimension for 16 different currency pairs, this lead to some interesting conclusions regarding market efficiency and which symbols might lead to a larger number of systems when performing mining exercises. Today I want to show you the results of performing this same exercise with another curve related statistical property, the Hurst exponent, using a fixed slice size. Interestingly the results of doing the same thing with the Hurst Exponent lead to rather similar conclusions which further reinforce the hypothesis behind the original idea within the fractal dimension post.
–

–
The Hurst Exponent – as I have mentioned on previous posts – is commonly used to evaluate the long term memory of a time series. It is a statistical property of each particular series – not of its distribution – which means that efficient and inefficient series are expected to have different Hurst Exponent values. Although we have already seen that the whole-series value of the Hurst Exponent cannot be distinguished from the values expected for efficient series this does not mean that HE calculations on slices cannot be useful. Since the HE is a property that is related with the character of the series we can have the same expectation that we had for the fractal dimension in terms of variations. A more constant HE across different consecutive slices should lead to series where finding systems should be easier.
The image above shows the result of calculating the standard deviation of the HE exponent using a slice size of 200 candles on 1H data from 1986 to 2016 for 16 different currency pairs. As you can see the standard deviation is the lowest for the EUR/USD, with other highly liquid symbols such as the USD/JPY, GBP/USD and USD/CHF having rather low values as well. In agreement with the fractal dimension experiment the highest values are also attributed to the USD/CAD and the EUR/CHF showing that for these two series the HE tends to fluctuate within a very wide range within the entire set of 200 windows present within the entire data. Even though the HE and the fractal dimension are two different properties the ranking of their standard deviation among the different pairs is still very similar across the same window size.
–

–
The autocorrelation of the HE also shows remarkably similar results. The series with the lowest auto-correlations are the series with the lowest standard deviation which matches the same thing we experienced when using the fractal dimension. The autocorrelation is also very high for the EUR/CHF and the USD/CAD, in line with previous results as well. This leads us to rather similar conclusions when it comes to the HE across a 200 window slice, we can say that symbols like the USD/CAD have HE values that are very similar across different slices but which vary within a larger range when we look at the entire data. We get symbols for which inefficiencies are present but not constant while in others we have inefficiencies that are less autocorrelated but much more stable.
With all the data presently available I believe I can start to formulate a theory about what leads to the finding of long term stable inefficiencies within financial time series. Not only must the character of a series be different from that of an efficient series but that character must be stable enough through time to be exploitable. This character can be measured across a variety of ways but it should in all cases lead to similar conclusions provided that the character is a series-specific property that is expected to be different for efficient and inefficient series. The standard deviation of these properties is very useful to establish this type of variability and we can probably build an “efficiency index” joining several deviation measurements for different statistics to pinpoint more accurately which symbols are more or less prone to the finding of long term inefficiencies.
–

–
Of course if you would like to learn more about financial time series and how you too can use advanced mining techniques to search for strategies within a symbol while properly accounting for data mining bias please consider joining Asirikuy.com, a website filled with educational videos, trading systems, development and a sound, honest and transparent approach towards automated trading.strategies


