Most traders tend to take execution for granted. Your trading system should generate a trading signal at some point in time and then enter a trade after the signal is received, it is most commonly assumed that this entry happens without any friction, just when the trading system wants it to happen. However in reality there is a lag between the time when the system receives the signal and when it executes it. This means that you will be facing a variable that is not included within simulations that may have either positive or negative consequences depending on how your system is affected by execution lags. On today’s blog post I want to share with you an analysis of trading costs from the perspective of some of our trading repository trades, which have taken more than 23K trades so far this month. The analysis within the present post is made using 23,993 trades executed across 5 different Oanda accounts for the month of May 2016 across 6 different currency pairs.
–

–
If we entered the market randomly then execution times would simply have a random effect in our end results. If we entered at points where there was no clear tendency for price to immediately move in either direction then taking a bit more time to enter would simply involve having a randomly different result from the original result we would have got. However when we trade strategies with positive historical edges that are not the result of random chance we have indeed located points where price does have a tendency to evolve in a certain manner and therefore lagging execution will possibly have a definitive effect towards either direction. This means that due to the expected directionality we might expect to see some clear effect favoring either positive or negative slippage if our execution lags.
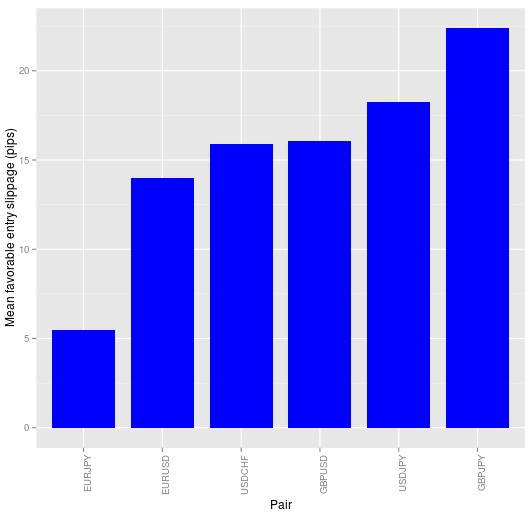
The above effect is clearly seen on the image above. If we calculate the difference between the ideal execution price (where we wanted to enter the market) and the point where we actually got in we can see that in general we have entries that are more favorable across all the symbols. This means that we entered longs at a lower price and we entered shorts at a higher price than what we intended. The average slippage increases dramatically as we move to more volatile symbols, with some symbols like the GBP/JPY having much larger average favorable slippage values. The above image might however give the wrong impression since it looks as though most trades were very positively impacted in terms of entries, when in reality this isn’t the case.
–

–
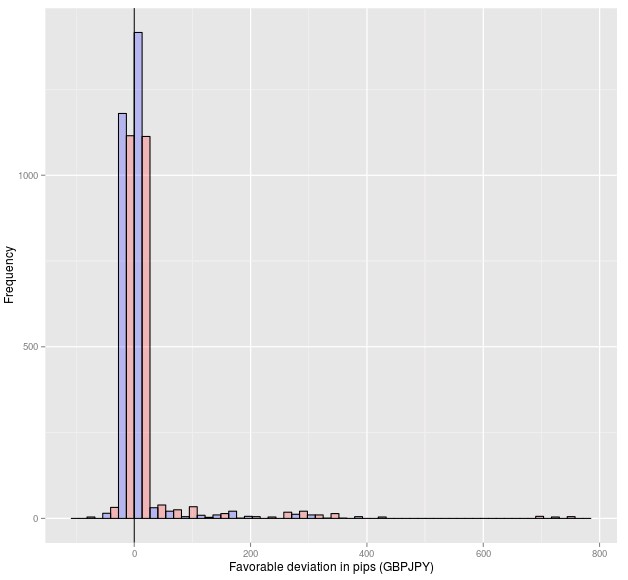
A look into the distribution of deviations for the GBPJPY shows clearly that most trades (87%) actually have relatively small deviations (-5 to 5 pips) while there are a small number of trades (3.6%) that have impressively large deviation values (100-800 pips). This has been the consequence of news releases where a small amount of time can cause a huge deviation in the expected entry values for this pair. If you have just a few trades with these huge deviations then they heavily skew the mean slippage to a really large value, even though the large majority of trades have almost no deviations, as under regular market conditions entries are quite precise. In the case above we have had entries that have in fact been much better than expected but this is mainly because the news events have gone heavily against the positions the strategies wanted to exploit this month. Under a profitable scenario it is likely that we would see a reversal of this effect – heavily unfavorable slippage – although we still haven’t been able to observe whether this is the case as we still haven’t seen favorable surprising news events.
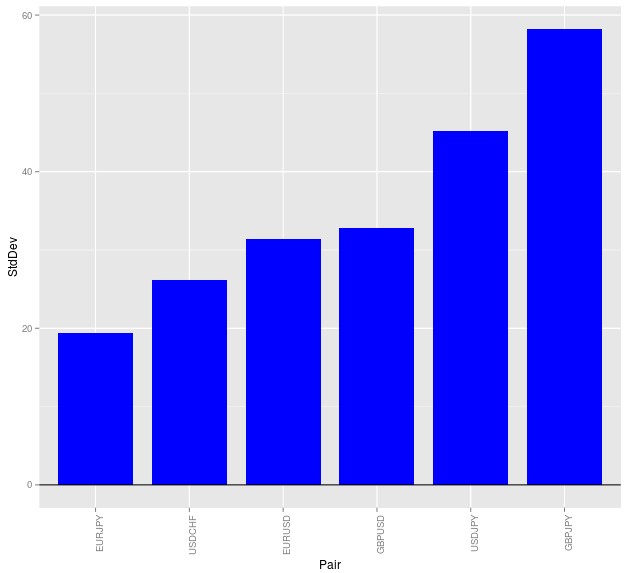
The image below shows the standard deviation of slippage for the different symbols in pips. As you can see the GBPJPY and USDJPY have the highest deviations as this month the most important effect on entries was caused by news from the bank of Japan and those two symbols had the most systems trading at hours where news were released. The EURJPY is obviously also affected by these news events but the number of EURJPY systems in our trading system repository is simply much lower – almost 3x lower than the number of systems we have for the USDJPY. Some of these largest deviations – for example some of the 600+ pips ones – were caused by technical issues within the setups that have been fixed since (for example that execution was delayed by a few hours due to some unintended server failure).
–

–
The above shows clearly how entries can be very heavily affected by the time it takes us to enter trades. Taking a few seconds to enter trades under market moving events can mean much more favorable or unfavorable entries, depending on how directionality moves after the event. Of course if the slippage is favorable then it means we took much lower losses than would have been expected from these trades but in an opposite scenario we might give a lot of profit back to the market as we would enter trades when the market has already moved significantly in our favor. It will take us some time to gather enough data to properly analyse this phenomena and really evaluate how strongly these deviations are compensated under different market conditions and whether our overall slippage does remain favorable after many months of trading. If you would like to learn more about system entries and how you too can build your own trading strategies please consider joining Asirikuy.com, a website filled with educational videos, trading systems, development and a sound, honest and transparent approach towards automated trading.


