One of the most important unknown when we started trading massively parallel portfolios was how long systems could be expected to live and how many systems we would have to discard as trading moved forward. During the past year we have had a significantly large number of trading strategies within our repository (thousands) which has now enabled us to gather these statistics and figure out exactly how many systems have failed as a function of time and whether failure stops at some point or continues indefinitely. On today’s post we’re going to talk about the values for these statistics for our repository, how I calculated them and what they tell us about our current price action based trading methodology.
–


–
Failure of trading strategies in our price action based repository is determined mainly by whether a strategy does or does not behave as it’s expected to. We discard strategies whenever their distribution of returns can be said to fall out of their expected performance with a 99% confidence – for which we use Monte Carlo simulations – and we also use linearity based criteria to determine failure. For example if a strategy’s R² falls below 0.9 it is discarded, same thing if it goes below a line that is 3.5 times the standard deviation of residuals from the linear regression below the central linear regression line.
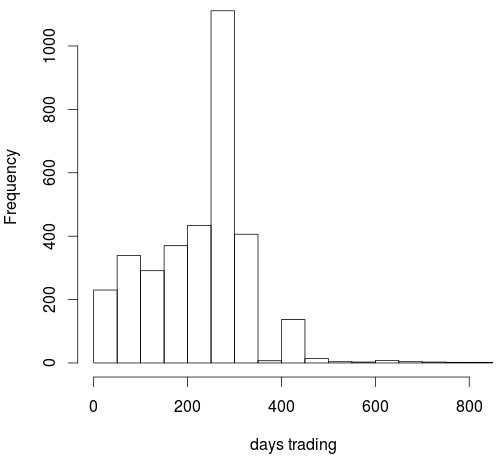
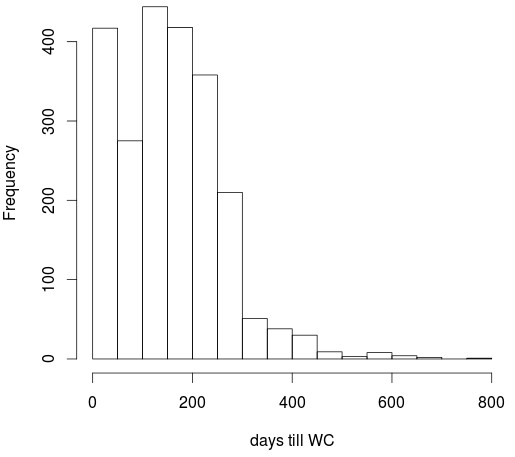
Knowing how we discard strategies we can now move onto calculating how many have failed and at what times they have tended to fail. For this we can calculate distributions of trading days for strategies that haven’t failed as well as days till WC for strategies that reached a WC scenario. As you can see in these distributions system failures tend to happen most often when systems are young – within the first 200 days – while failure after that are much less common. However you need to consider that our repository has got significantly bigger during the past year so the above distributions are biased because they tend to contain many more strategies that are younger which haven’t had time to fail at longer times. If most systems have only traded for about 6 months then it is clear that seeing failure rates above 6 months is going to be uncommon.
–

–
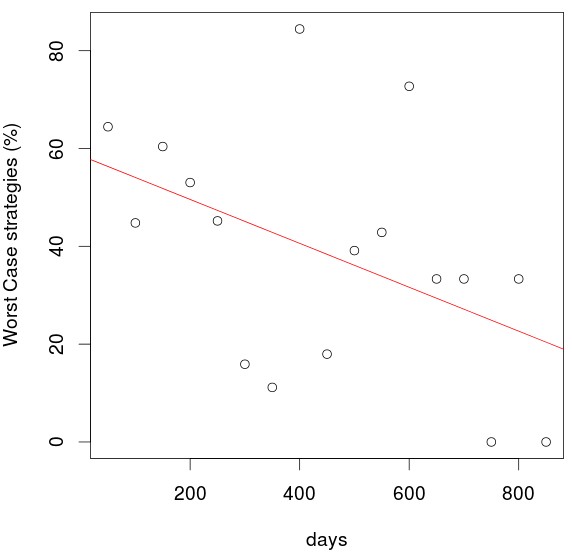
We can eliminate this influence by comparing apples-to-apples and determining the failure rate for strategies in each trading class. This can be done by comparing systems that failed in say 300-350 days with strategies that have been trading for 300-350 days and seeing what percentage of strategies have reached a worst case from all those that we have that have traded for this long. The image above shows the result of doing this for all the classes available. The data now becomes clearer and although we can still see a lot of variance – due to the fact that some classes have more representative populations than others – we can now see a trend – albeit a weak one – where failure rates become lower as the trading period becomes longer.
The implications of the above are important as it means that systems that have been trading for longer in a real out-of-sample and haven’t failed tend to have smaller failure rates while systems that have just been added tend to fail more. However this cannot be taken so lightly – an assumption of perfect linearity – as you can see that there are periods where systems tend to fail much more or much less which might stem simply from how market conditions developed when most of those strategies were added. Since our repository has only been active for a few years it does not cover enough market conditions for all this variance to go away.
–

–
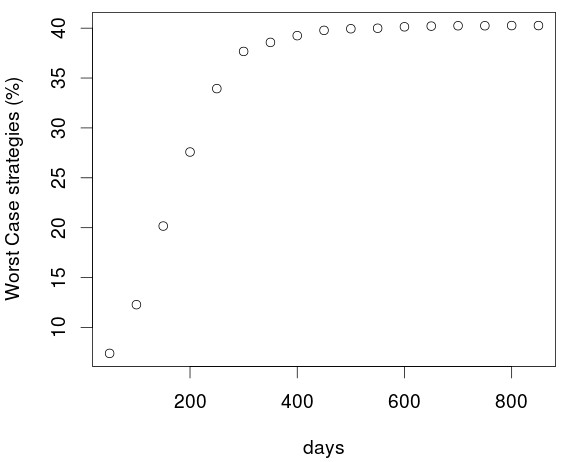
The last plot shows the cumulative failure of strategies as a function of trading time. We expect most systems to fail relatively quickly and then to reach a stable plateau at higher trading times where failure seems to be more difficult. Of course with the data we have we cannot know if the above relationships will hold forever since we still don’t have enough systems that have survived 800 days in order to know if the survival rate there is truly much higher. buy Pregabalin It is also worth noting that the above has nothing to do with profitability but merely with whether or not systems have behaved within their statistically expected boundaries, many systems that haven’t failed also haven’t been profitable because this might fall into what is reasonably expected from them at their current trading life threshold.
If you would like to learn more about our repository and how you too can trade any selection you want from our price action based systems please consider joining Asirikuy.com, a website filled with educational videos, trading systems, development and a sound, honest and transparent approach towards automated trading.strategies.


Hi Daniel,
have you already evaluated how the portfolio performance differs between randomly chosen systems and the R^2 selection criteria regarding reaching wc and performance?
Kind regards,
Fd
Hi Fd,
Thanks for writing. The issue with this type of test is that the MC worst cases do not make a lot of sense in randomly generated strategies because you have no reason to want to preserve the historical distribution of returns as most of the time this is a bad distribution. If you attempt to apply an MC worst case in this case you almost never discard strategies because you tend to tolerate much larger degrees of loss — as randomly picked systems tend to have almost perfectly losing equity curves for the past 30 years.
However in terms of performance I did the exercise for a sample of 500 portfolios using randomly picked systems with the same symbol distribution, adding systems at the same times we did — only that the added systems are totally random. The average return is around 3 times worse than what we have with an all-equally weighted portfolio, the difference really becomes noticeable after the first year as the negative accumulation of costs for the random trading scenarios is far worse. I will write a post about this test so that you can look into it in more detail. Thanks again for writing!
Best Regards,
Daniel