In the Forex market we do not have information on particular currencies – like the USD or the JPY – but what we have is information from the relative strength of a currency against another in the form of a currency pair. Due to this reason a currency pair can increase or decrease in value due to changes in the relative strength/weakness of one of the currencies involved or a combination of how both are changing. It would therefore be very useful if we could extract information that would represent a single currency instead of pairs as in this way we could look at what is driving overall movements in the market instead of having to look into more noisy pair data. On today’s post we are going to look into how we can use Independent Component Analysis (ICA) to derive this type of information from currency pairs. You can download the data and python script here to reproduce the results in this article.
–
#!/usr/bin/python
# Coded by Daniel Fernandez 2016
# http://mechanicalforex.com
# https://asirikuy.com

import pandas as pd
from sklearn.decomposition import FastICA
import matplotlib.pyplot as plt
import seaborn as sns

def plot_result(balance):

    fig, ax = plt.subplots(figsize=(12,8), dpi=100)
    ax.axhline(0.0, linestyle='dashed', color='black', linewidth=1.5)
    ax.set_xlabel('Date')
    ax.set_ylabel('Total change (%)')

    for i, column in enumerate(balance.columns):
        ax.plot(balance.index, balance[column], label=balance.columns[i])
    ax.legend(loc='lower center', ncol= 3, fancybox=True, shadow=True)

    ax.set_axisbelow(True)

    plt.show()

def main():

    symbols = ["EURUSD", "EURJPY", "USDJPY"]
    data_timeseries = pd.DataFrame()

    for symbol in symbols:
        rates = pd.read_csv(symbol+"1987_1440.csv", index_col=0, parse_dates=True, dayfirst=True, header=None, names=['open','high','low','close','vol'])
        data_timeseries[symbol] = (1+rates['close'].pct_change(fill_method='pad').ix[1:]).cumprod()

    ica_timeseries = FastICA(n_components=3)
    pure_currencies_from_timeseries = pd.DataFrame(ica_timeseries.fit_transform(data_timeseries)).set_index(data_timeseries.index)

    print "Mixing matrix from time series"
    print ica_timeseries.mixing_
    print ""

    plot_result(data_timeseries)
    plot_result(pure_currencies_from_timeseries)
–
Independent component analysis is an extremely useful technique to extract information when we assume that information comes from some uncontaminated original sources that are then linearly combined to obtain the observations we can actually see. The classic ICA examples is the “cocktail party” problem where you have a lot of people who are talking at the same time at a party and you have several microphones that are listening to the conversations. Every microphone hears the same conversations in a slightly different way and by applying ICA to the feed of these microphones we can actually extract all the individual conversations. If the number of microphones is at least as large as the number of conversations we are trying to listen for and there are no two identical microphones then the problem can be solved and the conversations can be separated.
The above problem can be analogous to what we have in the currency market. We can imagine that we have some original sources – the individual currency strengths – which are then combined to generate the currency pairs we can actually observe. By using ICA we can extract these original sources as long as we provide enough pairs that contain the “mixed” information. The script above uses time series from the EURUSD, EURJPY and USDJPY to extract 3 independent components that we can imagine as the fundamental drivers that generate the series for these currency pairs. The script uses data from the last 200 days from these pairs. I also included data for more currency pairs in the data file so that you can experiment with more symbols and independent components.
–

–
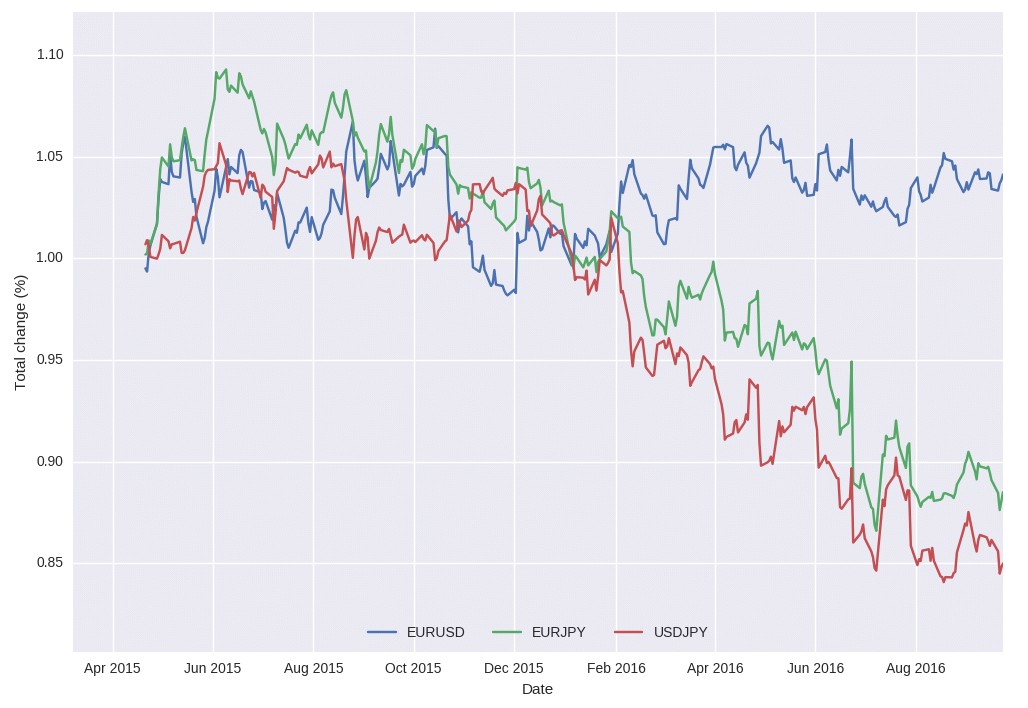
As you can see in the image above the overall movements for the USDJPY and the EURJPY have been highly correlated and down-trending during this year while movements for the EURUSD have been significantly different and rather flat. This plot provides us with little concrete information but it hints strongly that the sum of EUR and USD strength should have changed little while JPY strength should have increased through the year relative to EUR and USD strength. The ICA analysis can help us actually get this information in a mathematically formal way, without having to go through Index type calculations that are generally used to attempt to obtain this type of information.
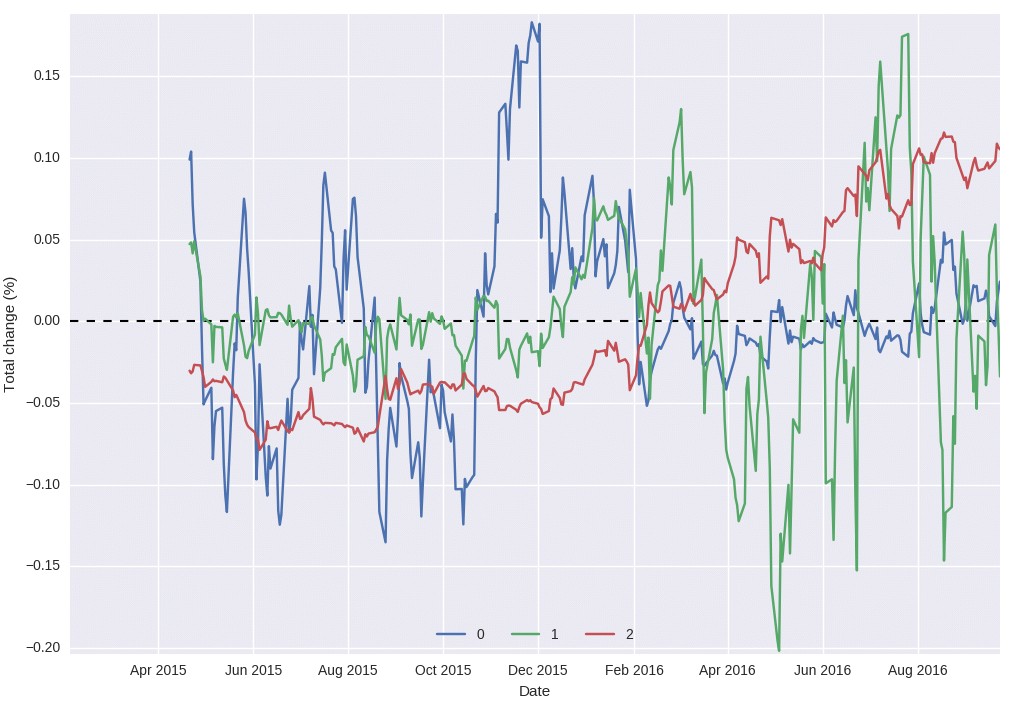
The plot below shows the ICA of the 3 components obtained using the script. We can see that there is indeed a component that changes significantly through the entire year while the other two components mainly whipsaw around the origin the whole time. We can interpret the red component as the main component that has driven the USDJPY and the EURJPY down constantly through the year – the JPY – while the other two components mainly determine the EUR and USD values. However we must be careful about such rushed interpretations as the mixing matrix reveals this to be more complex. The mixing matrix – which shows us the linear combination coefficients needed to return to the original series from the independent components – shows that the EURUSD is fundamentally made not only from the EUR and USD components but also in part from the JPY component. This means that there is something that determines JPY strength that is also a driver for determining the EURUSD.
In the USDJPY and EURJPY decompositions we have similar phenomena. In both cases the JPY component is an important driver – in particular for the EURJPY it is the main driver – and the secondary component is in one case the EUR and in the other case the USD. This is coherent with our interpretation of these components as being somewhat related to pure currency strengths although we again see the presence of the component that is not present as a smaller yet important part in determining each component’s value. This somewhat reflects the real nature of the markets in the sense that currencies are not simply affected by what happens in the respective countries or unions where the currencies come from but there is always an influence from other factors that in this case continues to be intermixed within the components.
–

–
The above provides a more satisfactory answer to the question of making strength measurements than traditional index based approaches. In particular you could always add additional symbols and try to draw the influence from each different component within the makeup of each pair. You could even add something like the SPY and see if you can separate a component that mainly determines stock prices but also drives currencies in some way. If you would like to learn more about algorithmic trading and how you too can get a deeper understanding of the market and create systems to trade it please consider joining Asirikuy.com, a website filled with educational videos, trading systems, development and a sound, honest and transparent approach towards automated trading.strategies


Hi Daniel,
First of all thanks for running this blog. You’re the only one (as far as I know) to put any scientific reasoning to all trading.
Now as for this analysis, I am wondering how can your script work out each of the component values without adding a false drift. Forex pairs only tell us about ratio of components not their real value (I understand this is all normalized). Let me give the example of my thinking:
Say (for simplicity) we only know that (our inputs):
b/c = 0.666
a/c = 0.333
b/a = 2.000
Now we want to calculate the underlying component values of a, b, and c.
We can guess that these values will fit the inputs:
a = 0.5
b = 1.0
c = 1.5
But also these values will give the same ratios:
a = 1.0
b = 2.0
c = 3.0
In fact we can multiply all of the components by whatever value to get the same ratios. As there is no reference point (or is there?) we can never be sure of the underlying components. We can of course fix one of the components to a constant value (say b=1.0) and easily compute the others but this might skew your results (for a and c). If the “real” value of b would be dropping linearly (and faster than changes of the others) this would make values of a and c shut up – something that is not really true.
Sorry for a too long a post – I’m an engineer and never liked using unknown or not well documented libraries as they often do some sort of assumptions that might be hidden from you. I use my own indicators based on the concept above (trying to get value of USD and EUR from other pairs assuming the “third” pair to be 1). This problem always seemed interesting to me. Please correct me if I’m wrong.
Hi Mac,
Thanks for writing. Perhaps the problem is that you’re trying to assume that the pairs are unique combinations of just two things, which of course does not allow you to solve the problem. This in reality is not the case, the EUR/USD is not merely a pure EUR component divided by a pure USD component but in reality it is a more complicated system where you have the sum of many different components that are not just purely these two. In this case in the Independent Component Analysis searching for three components in 3 pairs we find that the EUR/USD is mainly made from 2 components but also has contributions from a third component. If you used 5 pairs with 5 different symbols you would find that each pair was mostly the result of 2 components but contributions from the other 3 components would still exist. This is indeed a much more realistic analysis compared to simply assuming that the symbols are pure ratios, in reality the price of symbols is influenced by the market as a whole (this means that price for the EURUSD is not only set by a EUR and USD component but is influenced by many other market components). Thanks again for posting,
Best Regards,
Daniel
The results cannot be reproduced since the zip file doesn’t have all the original data sources.
File
USDJPY1987_1440.csv
is missing.